TTP IFVG Signals With EMA /ICT Gold scalpingThis script uses original logic and alerting rules. in Japan
finding ICT IFVG and EMA conditions.
#IFVG, Forex, ICT, EMA, Scalping, Indicator
This indicator automatically finds IFVG (Imbalance / Fair Value Gap) zones and gives you a buy or sell signal when price comes back and breaks out through that gap.
It also draws a colored box over the gap so you can see the zone visually, and it raises alerts when a new signal appears.
High-level logic:
On every bar, the script looks back up to “IFVG_GapBars” bars.
For each offset i it checks a 3-candle pattern:
– If the low of the newer candle is above the high of the older candle: bullish FVG (price jumped up, leaving a gap).
– If the high of the newer candle is below the low of the older candle: bearish FVG (price jumped down, leaving a gap).
When a valid FVG is found:
– For a bullish FVG it looks for a later close that breaks down through that gap (sell signal).
– For a bearish FVG it looks for a later close that breaks up through that gap (buy signal).
– A moving-average trend filter must agree (downtrend for sells, uptrend for buys).
– It checks that price has not already “filled” the gap before the breakout.
If all conditions are satisfied, it:
– Sets signal_dir = 1 for a buy, or -1 for a sell.
– Draws a box from the original FVG bar to the bar just before the breakout (extended a bit to the right), between the gap high and gap low.
– Plots an ▲ label for buys or ▼ label for sells.
– Triggers the corresponding alert conditions.
Now the parameters:
PipSizeMultilier (PipSizeManual)
Multiplies the symbol’s minimum tick size (syminfo.mintick).
It is used when converting “MinFVG_Pips” into an actual price distance.
If you feel the indicator is too sensitive (too many small gaps), you can increase this multiplier to effectively require a larger price difference.
TickSize
Internal value = syminfo.mintick * PipSizeMultiplier.
This is the actual price step the script uses as a “pip” when checking minimum gap size.
FVG Search Lookback (IFVG_GapBars)
How many bars back from the current bar the script will scan for a 3-candle FVG pattern.
Larger value = it can find older FVGs, but loop cost is higher.
Min FVG Size (Pips/Points) (MinFVG_Pips)
Minimum allowed size of the gap, measured in “pips/points” using TickSize.
If the vertical distance between the gap high and gap low is smaller than this, the gap is ignored.
0.0 means “no size filter” (every FVG is allowed).
FVG Epsilon (Price Units) (FVG_EpsPoints)
Tolerance for the FVG detection.
It is subtracted/added in the condition that checks “low > old high” or “high < old low”.
0.0 means strict gap (no overlap at all). A small positive epsilon allows tiny overlaps to still count as a gap.
Show IFVG Zones (ShowZones)
If true, the script draws a box over the IFVG zone when a signal is confirmed.
If false, no boxes are drawn; you only see the ▲ / ▼ markers and alerts.
Buy Zone Color (ZoneColorBuy)
Fill color and border color for boxes created from bearish FVGs that later produce a buy signal.
Sell Zone Color (ZoneColorSell)
Fill color and border color for boxes created from bullish FVGs that later produce a sell signal.
Box Extension (Bars) (BoxExtension)
How many extra bars to extend the right side of the box beyond the breakout bar.
The internal right coordinate is “bar_index - 1 + BoxExtension”.
Increase this if you want the zone to visually extend further into the future.
MA Period (MA_Period)
Lookback length of the moving average used as a trend filter.
MA Type (MA_Kind)
Type of moving average: “SMA” or “EMA”.
If SMA is chosen, the script uses ta.sma; if EMA, it uses ta.ema.
Moving-average filter behavior:
For sell signals (from bullish FVG): MA must be sloping down (MA < MA ) and price must be below MA.
For buy signals (from bearish FVG): MA must be sloping up (MA > MA ) and price must be above MA.
If these conditions are not satisfied, the FVG is ignored even if the gap and breakout conditions are met.
Signals and alerts:
signal_dir = 1 → buy signal, ▲ label below the bar, “IFVG Buy Alert” / “IFVG Buy/Sell Alert” can fire.
signal_dir = -1 → sell signal, ▼ label above the bar, “IFVG Sell Alert” / “IFVG Buy/Sell Alert” can fire.
signal_dir = 0 → no new signal on this bar.
In short:
This indicator finds 3-candle IFVG gaps, filters them by size and trend, waits for a clean breakout through the gap, draws a box on the original gap zone, and gives you a clear buy or sell signal plus alerts.
Cari dalam skrip untuk "Buy sell"

Market Profile Dominance Analyzer# Market Profile Dominance Analyzer
## 📊 OVERVIEW
**Market Profile Dominance Analyzer** is an advanced multi-factor indicator that combines Market Profile methodology with composite dominance scoring to identify buyer and seller strength across higher timeframes. Unlike traditional volume profile indicators that only show volume distribution, or simple buyer/seller indicators that only compare candle colors, this script integrates six distinct analytical components into a unified dominance measurement system.
This indicator helps traders understand **WHO controls the market** by analyzing price position relative to Market Profile key levels (POC, Value Area) combined with volume distribution, momentum, and trend characteristics.
## 🎯 WHAT MAKES THIS ORIGINAL
### **Hybrid Analytical Approach**
This indicator uniquely combines two separate methodologies that are typically analyzed independently:
1. **Market Profile Analysis** - Calculates Point of Control (POC) and Value Area (VA) using volume distribution across price channels on higher timeframes
2. **Multi-Factor Dominance Scoring** - Weights six independent factors to produce a composite dominance index
### **Six-Factor Composite Analysis**
The dominance score integrates:
- Price position relative to POC (equilibrium assessment)
- Price position relative to Value Area boundaries (acceptance/rejection zones)
- Volume imbalance within Value Area (institutional bias detection)
- Price momentum (directional strength)
- Volume trend comparison (participation analysis)
- Normalized Value Area position (precise location within fair value zone)
### **Adaptive Higher Timeframe Integration**
The script features an intelligent auto-selection system that automatically chooses appropriate higher timeframes based on the current chart period, ensuring optimal Market Profile structure regardless of the trading timeframe being analyzed.
## 💡 HOW IT WORKS
### **Market Profile Construction**
The indicator builds a Market Profile structure on a higher timeframe by:
1. **Session Identification** - Detects new higher timeframe sessions using `request.security()` to ensure accurate period boundaries
2. **Data Accumulation** - Stores high, low, and volume data for all bars within the current higher timeframe session
3. **Channel Distribution** - Divides the session's price range into configurable channels (default: 20 rows)
4. **Volume Mapping** - Distributes each bar's volume proportionally across all price channels it touched
### **Key Level Calculation**
**Point of Control (POC)**
- Identifies the price channel with the highest accumulated volume
- Represents the price level where the most trading activity occurred
- Serves as a magnetic level where price often returns
**Value Area (VA)**
- Starts at POC and expands both upward and downward
- Includes channels until reaching the specified percentage of total volume (default: 70%)
- Expansion algorithm compares adjacent volumes and prioritizes the direction with higher activity
- Defines the "fair value" zone where most market participants agreed to trade
### **Dominance Score Formula**
```
Dominance Score = (price_vs_poc × 10) +
(price_vs_va × 5) +
(volume_imbalance × 0.5) +
(price_momentum × 100) +
(volume_trend × 5) +
(va_position × 15)
```
**Component Breakdown:**
- **price_vs_poc**: +1 if above POC, -1 if below (shows which side of equilibrium)
- **price_vs_va**: +2 if above VAH, -2 if below VAL, 0 if inside VA
- **volume_imbalance**: Percentage difference between upper and lower VA volumes
- **price_momentum**: 5-period SMA of price change (directional acceleration)
- **volume_trend**: Compares 5-period vs 20-period volume averages
- **va_position**: Normalized position within Value Area (-1 to +1)
The composite score is then smoothed using EMA with configurable sensitivity to reduce noise while maintaining responsiveness.
### **Market State Determination**
- **BUYERS Dominant**: Smooth dominance > +10 (bullish control)
- **SELLERS Dominant**: Smooth dominance < -10 (bearish control)
- **NEUTRAL**: Between -10 and +10 (balanced market)
## 📈 HOW TO USE THIS INDICATOR
### **Trend Identification**
- **Green background** indicates buyers are in control - look for long opportunities
- **Red background** indicates sellers are in control - look for short opportunities
- **Gray background** indicates neutral market - consider range-bound strategies
### **Signal Interpretation**
**Buy Signals** (green triangle) appear when:
- Dominance crosses above -10 from oversold conditions
- Previous state was not already bullish
- Suggests shift from seller to buyer control
**Sell Signals** (red triangle) appear when:
- Dominance crosses below +10 from overbought conditions
- Previous state was not already bearish
- Suggests shift from buyer to seller control
### **Value Area Context**
Monitor the information table (top-right) to understand market structure:
- **Price vs POC**: Shows if trading above/below equilibrium
- **Volume Imbalance**: Positive values favor buyers, negative favors sellers
- **Market State**: Current dominant force (BUYERS/SELLERS/NEUTRAL)
### **Multi-Timeframe Strategy**
The auto-timeframe feature analyzes higher timeframe structure:
- On 1-minute charts → analyzes 2-hour structure
- On 5-minute charts → analyzes Daily structure
- On 15-minute charts → analyzes Weekly structure
- On Daily charts → analyzes Yearly structure
This higher timeframe context helps avoid counter-trend trades against the dominant force.
### **Confluence Trading**
Strongest signals occur when multiple factors align:
1. Price above VAH + positive volume imbalance + buyers dominant = Strong bullish setup
2. Price below VAL + negative volume imbalance + sellers dominant = Strong bearish setup
3. Price at POC + neutral state = Potential breakout/breakdown pivot
## ⚙️ INPUT PARAMETERS
- **Higher Time Frame**: Select specific HTF or use 'Auto' for intelligent selection
- **Value Area %**: Percentage of volume contained in VA (default: 70%)
- **Show Buy/Sell Signals**: Toggle signal triangles visibility
- **Show Dominance Histogram**: Toggle histogram display
- **Signal Sensitivity**: EMA period for dominance smoothing (1-20, default: 5)
- **Number of Channels**: Market Profile resolution (10-50, default: 20)
- **Color Settings**: Customize buyer, seller, and neutral colors
## 🎨 VISUAL ELEMENTS
- **Histogram**: Shows smoothed dominance score (green = buyers, red = sellers)
- **Zero Line**: Neutral equilibrium reference
- **Overbought/Oversold Lines**: ±50 levels marking extreme dominance
- **Background Color**: Highlights current market state
- **Information Table**: Displays key metrics (state, dominance, POC relationship, volume imbalance, timeframe, bars in session, total volume)
- **Signal Shapes**: Triangle markers for buy/sell signals
## 🔔 ALERTS
The indicator includes three alert conditions:
1. **Buyers Dominate** - Fires on buy signal crossovers
2. **Sellers Dominate** - Fires on sell signal crossovers
3. **Dominance Shift** - Fires when dominance crosses zero line
## 📊 BEST PRACTICES
### **Timeframe Selection**
- **Scalping (1-5min)**: Focus on 2H-4H dominance shifts
- **Day Trading (15-60min)**: Monitor Daily and Weekly structure
- **Swing Trading (4H-Daily)**: Track Weekly and Monthly dominance
### **Confirmation Strategies**
1. **Trend Following**: Enter in direction of dominance above/below ±20
2. **Reversal Trading**: Fade extreme readings beyond ±50 when diverging with price
3. **Breakout Trading**: Look for dominance expansion beyond ±30 with increasing volume
### **Risk Management**
- Avoid trading during NEUTRAL states (dominance between -10 and +10)
- Use POC levels as logical stop-loss placement
- Consider VAH/VAL as profit targets for mean reversion
## ⚠️ LIMITATIONS & WARNINGS
**Data Requirements**
- Requires sufficient historical data on current chart (minimum 100 bars recommended)
- Lower timeframes may show fewer bars per HTF session initially
- More accurate results after several complete HTF sessions have formed
**Not a Standalone System**
- This indicator analyzes market structure and participant control
- Should be combined with price action, support/resistance, and risk management
- Does not guarantee profitable trades - past dominance does not predict future results
**Repainting Characteristics**
- Higher timeframe levels (POC, VAH, VAL) update as new bars form within the session
- Dominance score recalculates with each new bar
- Historical signals remain fixed, but current session data is developing
**Volume Limitations**
- Uses exchange-provided volume data which varies by instrument type
- Forex and some CFDs use tick volume (not actual transaction volume)
- Most accurate on instruments with reliable volume data (stocks, futures, crypto)
## 🔍 TECHNICAL NOTES
**Performance Optimization**
- Uses `max_bars_back=5000` for extended historical analysis
- Efficient array management prevents memory issues
- Automatic cleanup of session data on new period
**Calculation Method**
- Market Profile uses actual volume distribution, not TPO (Time Price Opportunity)
- Value Area expansion follows traditional Market Profile auction theory
- All calculations occur on the chart's current symbol and timeframe
## 📚 EDUCATIONAL VALUE
This indicator helps traders understand:
- How institutional traders use Market Profile to identify fair value
- The relationship between price, volume, and market acceptance
- Multi-factor analysis techniques for assessing market conditions
- The importance of higher timeframe structure in trade planning
## 🎓 RECOMMENDED READING
To better understand the concepts behind this indicator:
- "Mind Over Markets" by James Dalton (Market Profile foundations)
- "Markets in Profile" by James Dalton (Value Area analysis)
- Volume Profile analysis in institutional trading
## 💬 USAGE TERMS
This indicator is provided as an educational and analytical tool. It does not constitute financial advice, investment recommendations, or trading signals. Users are responsible for their own trading decisions and should conduct their own research and due diligence.
Trading involves substantial risk of loss. Past performance does not guarantee future results. Always use proper risk management and never risk more than you can afford to lose.

Seasonality Heatmap [QuantAlgo]🟢 Overview
The Seasonality Heatmap analyzes years of historical data to reveal which months and weekdays have consistently produced gains or losses, displaying results through color-coded tables with statistical metrics like consistency scores (1-10 rating) and positive occurrence rates. By calculating average returns for each calendar month and day-of-week combination, it identifies recognizable seasonal patterns (such as which months or weekdays tend to rally versus decline) and synthesizes this into actionable buy low/sell high timing possibilities for strategic entries and exits. This helps traders and investors spot high-probability seasonal windows where assets have historically shown strength or weakness, enabling them to align positions with recurring bull and bear market patterns.
🟢 How It Works
1. Monthly Heatmap
How % Return is Calculated:
The indicator fetches monthly closing prices (or Open/High/Low based on user selection) and calculates the percentage change from the previous month:
(Current Month Price - Previous Month Price) / Previous Month Price × 100
Each cell in the heatmap represents one month's return in a specific year, creating a multi-year historical view
Colors indicate performance intensity: greener/brighter shades for higher positive returns, redder/brighter shades for larger negative returns
What Averages Mean:
The "Avg %" row displays the arithmetic mean of all historical returns for each calendar month (e.g., averaging all Januaries together, all Februaries together, etc.)
This metric identifies historically recurring patterns by showing which months have tended to rise or fall on average
Positive averages indicate months that have typically trended upward; negative averages indicate historically weaker months
Example: If April shows +18.56% average, it means April has averaged a 18.56% gain across all years analyzed
What Months Up % Mean:
Shows the percentage of historical occurrences where that month had a positive return (closed higher than the previous month)
Calculated as:
(Number of Months with Positive Returns / Total Months) × 100
Values above 50% indicate the month has been positive more often than negative; below 50% indicates more frequent negative months
Example: If October shows "64%", then 64% of all historical Octobers had positive returns
What Consistency Score Means:
A 1-10 rating that measures how predictable and stable a month's returns have been
Calculated using the coefficient of variation (standard deviation / mean) - lower variation = higher consistency
High scores (8-10, green): The month has shown relatively stable behavior with similar outcomes year-to-year
Medium scores (5-7, gray): Moderate consistency with some variability
Low scores (1-4, red): High variability with unpredictable behavior across different years
Example: A consistency score of 8/10 indicates the month has exhibited recognizable patterns with relatively low deviation
What Best Means:
Shows the highest percentage return achieved for that specific month, along with the year it occurred
Reveals the maximum observed upside and identifies outlier years with exceptional performance
Useful for understanding the range of possible outcomes beyond the average
Example: "Best: 2016: +131.90%" means the strongest January in the dataset was in 2016 with an 131.90% gain
What Worst Means:
Shows the most negative percentage return for that specific month, along with the year it occurred
Reveals maximum observed downside and helps understand the range of historical outcomes
Important for risk assessment even in months with positive averages
Example: "Worst: 2022: -26.86%" means the weakest January in the dataset was in 2022 with a 26.86% loss
2. Day-of-Week Heatmap
How % Return is Calculated:
Calculates the percentage change from the previous day's close to the current day's price (based on user's price source selection)
Returns are aggregated by day of the week within each calendar month (e.g., all Mondays in January, all Tuesdays in January, etc.)
Each cell shows the average performance for that specific day-month combination across all historical data
Formula:
(Current Day Price - Previous Day Close) / Previous Day Close × 100
What Averages Mean:
The "Avg %" row at the bottom aggregates all months together to show the overall average return for each weekday
Identifies broad weekly patterns across the entire dataset
Calculated by summing all daily returns for that weekday across all months and dividing by total observations
Example: If Monday shows +0.04%, Mondays have averaged a 0.04% change across all months in the dataset
What Days Up % Mean:
Shows the percentage of historical occurrences where that weekday had a positive return
Calculated as:
(Number of Positive Days / Total Days Observed) × 100
Values above 50% indicate the day has been positive more often than negative; below 50% indicates more frequent negative days
Example: If Fridays show "54%", then 54% of all Fridays in the dataset had positive returns
What Consistency Score Means:
A 1-10 rating measuring how stable that weekday's performance has been across different months
Based on the coefficient of variation of daily returns for that weekday across all 12 months
High scores (8-10, green): The weekday has shown relatively consistent behavior month-to-month
Medium scores (5-7, gray): Moderate consistency with some month-to-month variation
Low scores (1-4, red): High variability across months, with behavior differing significantly by calendar month
Example: A consistency score of 7/10 for Wednesdays means they have performed with moderate consistency throughout the year
What Best Means:
Shows which calendar month had the strongest average performance for that specific weekday
Identifies favorable day-month combinations based on historical data
Format shows the month abbreviation and the average return achieved
Example: "Best: Oct: +0.20%" means Mondays averaged +0.20% during October months in the dataset
What Worst Means:
Shows which calendar month had the weakest average performance for that specific weekday
Identifies historically challenging day-month combinations
Useful for understanding which month-weekday pairings have shown weaker performance
Example: "Worst: Sep: -0.35%" means Tuesdays averaged -0.35% during September months in the dataset
3. Optimal Timing Table/Summary Table
→ Best Month to BUY: Identifies the month with the lowest average return (most negative or least positive historically), representing periods where prices have historically been relatively lower
Based on the observation that buying during historically weaker months may position for subsequent recovery
Shows the month name, its average return, and color-coded performance
Example: If May shows -0.86% as "Best Month to BUY", it means May has historically averaged -0.86% in the analyzed period
→ Best Month to SELL: Identifies the month with the highest average return (most positive historically), representing periods where prices have historically been relatively higher
Based on historical strength patterns in that month
Example: If July shows +1.42% as "Best Month to SELL", it means July has historically averaged +1.42% gains
→ 2nd Best Month to BUY: The second-lowest performing month based on average returns
Provides an alternative timing option based on historical patterns
Offers flexibility for staged entries or when the primary month doesn't align with strategy
Example: Identifies the next-most favorable historical buying period
→ 2nd Best Month to SELL: The second-highest performing month based on average returns
Provides an alternative exit timing based on historical data
Useful for staged profit-taking or multiple exit opportunities
Identifies the secondary historical strength period
Note: The same logic applies to "Best Day to BUY/SELL" and "2nd Best Day to BUY/SELL" rows, which identify weekdays based on average daily performance across all months. Days with lowest averages are marked as buying opportunities (historically weaker days), while days with highest averages are marked for selling (historically stronger days).
🟢 Examples
Example 1: NVIDIA NASDAQ:NVDA - Strong May Pattern with High Consistency
Analyzing NVIDIA from 2015 onwards, the Monthly Heatmap reveals May averaging +15.84% with 82% of months being positive and a consistency score of 8/10 (green). December shows -1.69% average with only 40% of months positive and a low 1/10 consistency score (red). The Optimal Timing table identifies December as "Best Month to BUY" and May as "Best Month to SELL." A trader recognizes this high-probability May strength pattern and considers entering positions in late December when prices have historically been weaker, then taking profits in May when the seasonal tailwind typically peaks. The high consistency score in May (8/10) provides additional confidence that this pattern has been relatively stable year-over-year.
Example 2: Crypto Market Cap CRYPTOCAP:TOTALES - October Rally Pattern
An investor examining total crypto market capitalization notices September averaging -2.42% with 45% of months positive and 5/10 consistency, while October shows a dramatic shift with +16.69% average, 90% of months positive, and an exceptional 9/10 consistency score (blue). The Day-of-Week heatmap reveals Mondays averaging +0.40% with 54% positive days and 9/10 consistency (blue), while Thursdays show only +0.08% with 1/10 consistency (yellow). The investor uses this multi-layered analysis to develop a strategy: enter crypto positions on Thursdays during late September (combining the historically weak month with the less consistent weekday), then hold through October's historically strong period, considering exits on Mondays when intraweek strength has been most consistent.
Example 3: Solana BINANCE:SOLUSDT - Extreme January Seasonality
A cryptocurrency trader analyzing Solana observes an extraordinary January pattern: +59.57% average return with 60% of months positive and 8/10 consistency (teal), while May shows -9.75% average with only 33% of months positive and 6/10 consistency. August also displays strength at +59.50% average with 7/10 consistency. The Optimal Timing table confirms May as "Best Month to BUY" and January as "Best Month to SELL." The Day-of-Week data shows Sundays averaging +0.77% with 8/10 consistency (teal). The trader develops a seasonal rotation strategy: accumulate SOL positions during May weakness, hold through the historically strong January period (which has shown this extreme pattern with reasonable consistency), and specifically target Sunday exits when the weekday data shows the most recognizable strength pattern.

ATAI Volume Pressure Analyzer V 1.0 — Pure Up/DownATAI Volume Pressure Analyzer V 1.0 — Pure Up/Down
Overview
Volume is a foundational tool for understanding the supply–demand balance. Classic charts show only total volume and don’t tell us what portion came from buying (Up) versus selling (Down). The ATAI Volume Pressure Analyzer fills that gap. Built on Pine Script v6, it scans a lower timeframe to estimate Up/Down volume for each host‑timeframe candle, and presents “volume pressure” in a compact HUD table that’s comparable across symbols and timeframes.
1) Architecture & Global Settings
Global Period (P, bars)
A single global input P defines the computation window. All measures—host‑TF volume moving averages and the half‑window segment sums—use this length. Default: 55.
Timeframe Handling
The core of the indicator is estimating Up/Down volume using lower‑timeframe data. You can set a custom lower timeframe, or rely on auto‑selection:
◉ Second charts → 1S
◉ Intraday → 1 minute
◉ Daily → 5 minutes
◉ Otherwise → 60 minutes
Lower TFs give more precise estimates but shorter history; higher TFs approximate buy/sell splits but provide longer history. As a rule of thumb, scan thin symbols at 5–15m, and liquid symbols at 1m.
2) Up/Down Volume & Derived Series
The script uses TradingView’s library function tvta.requestUpAndDownVolume(lowerTf) to obtain three values:
◉ Up volume (buyers)
◉ Down volume (sellers)
◉ Delta (Up − Down)
From these we define:
◉ TF_buy = |Up volume|
◉ TF_sell = |Down volume|
◉ TF_tot = TF_buy + TF_sell
◉ TF_delta = TF_buy − TF_sell
A positive TF_delta indicates buyer dominance; a negative value indicates selling pressure. To smooth noise, simple moving averages of TF_buy and TF_sell are computed over P and used as baselines.
3) Key Performance Indicators (KPIs)
Half‑window segmentation
To track momentum shifts, the P‑bar window is split in half:
◉ C→B: the older half
◉ B→A: the newer half (toward the current bar)
For each half, the script sums buy, sell, and delta. Comparing the two halves reveals strengthening/weakening pressure. Example: if AtoB_delta < CtoB_delta, recent buying pressure has faded.
[ 4) HUD (Table) Display /i]
Colors & Appearance
Two main color inputs define the theme: a primary color and a negative color (used when Δ is negative). The panel background uses a translucent version of the primary color; borders use the solid primary color. Text defaults to the primary color and flips to the negative color when a block’s Δ is negative.
Layout
The HUD is a 4×5 table updated on the last bar of each candle:
◉ Row 1 (Meta): indicator name, P length, lower TF, host TF
◉ Row 2 (Host TF): current ↑Buy, ↓Sell, ΔDelta; plus Σ total and SMA(↑/↓)
◉ Row 3 (Segments): C→B and B→A blocks with ↑/↓/Δ
◉ Rows 4–5: reserved for advanced modules (Wings, α/β, OB/OS, Top
5) Advanced Modules
5.1 Wings
“Wings” visualize volume‑driven movement over C→B (left wing) and B→A (right wing) with top/bottom lines and a filled band. Slopes are ATR‑per‑bar normalized for cross‑symbol/TF comparability and converted to angles (degrees). Coloring mirrors HUD sign logic with a near‑zero threshold (default ~3°):
◉ Both lines rising → blue (bullish)
◉ Both falling → red (bearish)
◉ Mixed/near‑zero → gray
Left wing reflects the origin of the recent move; right wing reflects the current state.
5.2 α / β at Point B
We compute the oriented angle between the two wings at the midpoint B:
β is the bottom‑arc angle; α = 360° − β is the top‑arc angle.
◉ Large α (>180°) or small β (<180°) flags meaningful imbalance.
◉ Intuition: large α suggests potential selling pressure; small β implies fragile support. HUD cells highlight these conditions.
5.3 OB/OS Spike
OverBought/OverSold (OB/OS) labels appear when directional volume spikes align with a 7‑oscillator vote (RSI, Stoch, %R, CCI, MFI, DeMarker, StochRSI).
◉ OB label (red): unusually high sell volume + enough OB votes
◉ OS label (teal): unusually high buy volume + enough OS votes
Minimum votes and sync window are user‑configurable; dotted connectors can link labels to the candle wick.
5.4 Top3 Volume Peaks
Within the P window the script ranks the top three BUY peaks (B1–B3) and top three SELL peaks (S1–S3).
◉ B1 and S1 are drawn as horizontal resistance (at B1 High) and support (at S1 Low) zones with adjustable thickness (ticks/percent/ATR).
◉ The HUD dedicates six cells to show ↑/↓/Δ for each rank, and prints the exact High (B1) and Low (S1) inline in their cells.
6) Reading the HUD — A Quick Checklist
◉ Meta: Confirm P and both timeframes (host & lower).
◉ Host TF block: Compare current ↑/↓/Δ against their SMAs.
◉ Segments: Contrast C→B vs B→A deltas to gauge momentum change.
◉ Wings: Right‑wing color/angle = now; left wing = recent origin.
◉ α / β: Look for α > 180° or β < 180° as imbalance cues.
◉ OB/OS: Note labels, color (red/teal), and the vote count.
◉Top3: Keep B1 (resistance) and S1 (support) on your radar.
Use these together to sketch scenarios and invalidation levels; never rely on a single signal in isolation.
[ 7) Example Highlights (What the table conveys) /i]
◉ Row 1 shows the indicator name, the analysis length P (default 55), and both TFs used for computation and display.
◉ B1 / S1 blocks summarize each side’s peak within the window, with Δ indicating buyer/seller dominance at that peak and inline price (B1 High / S1 Low) for actionable levels.
◉ Angle cells for each wing report the top/bottom line angles vs. the horizontal, reflecting the directional posture.
◉ Ranks B2/B3 and S2/S3 extend context beyond the top peak on each side.
◉ α / β cells quantify the orientation gap at B; changes reflect shifting buyer/seller influence on trend strength.
Together these visuals often reveal whether the “wings” resemble a strong, upward‑tilted arm supported by buyer volume—but always corroborate with your broader toolkit
8) Practical Tips & Tuning
◉ Choose P by market structure. For daily charts, 34–89 bars often works well.
◉ Lower TF choice: Thin symbols → 5–15m; liquid symbols → 1m.
◉ Near‑zero angle: In noisy markets, consider 5–7° instead of 3°.
◉ OB/OS votes: Daily charts often work with 3–4 votes; lower TFs may prefer 4–5.
◉ Zone thickness: Tie B1/S1 zone thickness to ATR so it scales with volatility.
◉ Colors: Feel free to theme the primary/negative colors; keep Δ<0 mapped to the negative color for readability.
Combine with price action: Use this indicator alongside structure, trendlines, and other tools for stronger decisions.
Technical Notes
Pine Script v6.
◉ Up/Down split via TradingView/ta library call requestUpAndDownVolume(lowerTf).
◉ HUD‑first design; drawings for Wings/αβ/OBOS/Top3 align with the same sign/threshold logic used in the table.
Disclaimer: This indicator is provided solely for educational and analytical purposes. It does not constitute financial advice, nor is it a recommendation to buy or sell any security. Always conduct your own research and use multiple tools before making trading decisions.

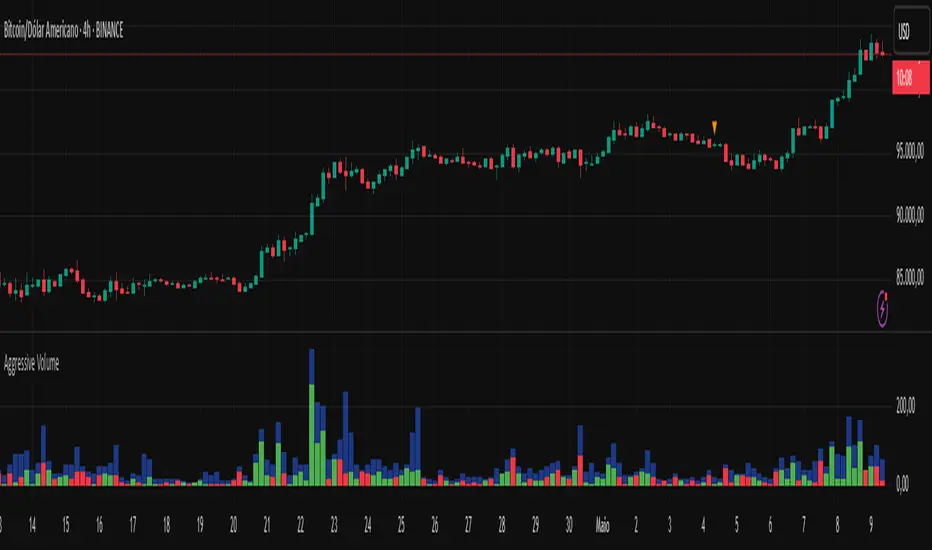
Aggressive Volume 📊 Indicator: Aggressive Volume – Simulated Buy/Sell Pressure
Aggressive Volume estimates delta volume using candle data to simulate the market’s internal buy/sell pressure. It helps visualize how aggressive buyers or sellers are moving the price without needing full order flow access.
⚙️ How It Works:
Calculates simulated delta volume based on candle direction and volume.
Bullish candles (close > open) suggest dominance by buyers.
Bearish candles (close < open) suggest dominance by sellers.
Delta is the difference between simulated buying and selling pressure.
🔍 Key Features:
Visual bars showing aggressive buyer vs seller dominance
Helps spot trend strength, momentum bursts, and potential reversals
Simple, effective, and compatible with any timeframe
Lightweight and ideal for scalping, day trading, and swing trading
💡 How to Use:
Look for strong positive delta during bullish trends for confirmation.
Watch for delta weakening or divergence as potential reversal signals.
Combine with trend indicators or price action for enhanced accuracy.
📊 Indicador: Volume Agressivo – Pressão de Compra/Venda Simulada
Volume Agressivo estima o delta de volume utilizando dados dos candles para simular a pressão interna de compra/venda do mercado. Ele ajuda a visualizar como os compradores ou vendedores agressivos estão movendo o preço, sem precisar de acesso completo ao fluxo de ordens.
⚙️ Como Funciona:
Calcula o delta de volume simulado com base na direção do candle e no volume.
Candles de alta (fechamento > abertura) indicam predominância de compradores.
Candles de baixa (fechamento < abertura) indicam predominância de vendedores.
O delta é a diferença entre a pressão de compra e venda simulada.
🔍 Principais Funcionalidades:
Barras visuais mostrando a dominância de compradores vs vendedores agressivos
Ajuda a identificar a força da tendência, explosões de momentum e possíveis reversões
Simples, eficaz e compatível com qualquer período de tempo
Leve e ideal para scalping, day trading e swing trading
💡 Como Usar:
Procure por delta positivo forte durante tendências de alta para confirmação.
Observe o delta enfraquecendo ou divergências como sinais de possível reversão.
Combine com indicadores de tendência ou price action para maior precisão.
Nef33-Volume Footprint ApproximationDescription of the "Volume Footprint Approximation" Indicator
Purpose
The "Volume Footprint Approximation" indicator is a tool designed to assist traders in analyzing market volume dynamics and anticipating potential trend changes in price. It is inspired by the concept of a volume footprint chart, which visualizes the distribution of trading volume across different price levels. However, since TradingView does not provide detailed intrabar data for all users, this indicator approximates the behavior of a footprint chart by using available volume and price data (open, close, volume) to classify volume as buy or sell, calculate volume delta, detect imbalances, and generate trend change signals.
The indicator is particularly useful for identifying areas of high buying or selling activity, imbalances between supply and demand, delta divergences, and potential reversal points in the market. It provides specific signals for bullish and bearish trend changes, making it suitable for traders looking to trade reversals or confirm trends.
How It Works
The indicator uses volume and price data from each candlestick to perform the following calculations:
Volume Classification:
Classifies the volume of each candlestick as "buy" or "sell" based on price movement:
If the closing price is higher than the opening price (close > open), the volume is classified as "buy."
If the closing price is lower than the opening price (close < open), the volume is classified as "sell."
If the closing price equals the opening price (close == open), it compares with the previous close to determine the direction:
If the current close is higher than the previous close, it is classified as "buy."
If the current close is lower than the previous close, it is classified as "sell."
If the current close equals the previous close, the classification from the previous bar is used.
Delta Calculation:
Calculates the volume delta as the difference between buy volume and sell volume (buyVolume - sellVolume).
A positive delta indicates more buy volume; a negative delta indicates more sell volume.
Imbalance Detection:
Identifies imbalances between buy and sell volume:
A buy imbalance occurs when buy volume exceeds sell volume by a defined percentage (default is 300%).
A sell imbalance occurs when sell volume exceeds buy volume by the same percentage.
Delta Divergence Detection:
Positive Delta Divergence: Occurs when the price is falling (for at least 2 bars) but the delta is increasing or becomes positive, indicating that buyers are entering despite the price decline.
Negative Delta Divergence: Occurs when the price is rising (for at least 2 bars) but the delta is decreasing or becomes negative, indicating that sellers are entering despite the price increase.
Trend Change Signals:
Bullish Signal (trendChangeBullish): Generated when the following conditions are met:
There is a positive delta divergence.
The delta has moved from a negative value (e.g., -500) to a positive value (e.g., +200) over the last 3 bars.
There is a buy imbalance.
The price is near a historical support level (approximated as the lowest low of the last 50 bars).
Bearish Signal (trendChangeBearish): Generated when the following conditions are met:
There is a negative delta divergence.
The delta has moved from a positive value (e.g., +500) to a negative value (e.g., -200) over the last 3 bars.
There is a sell imbalance.
The price is near a historical resistance level (approximated as the highest high of the last 50 bars).
Visual Elements
The indicator is displayed in a separate panel below the price chart (overlay=false) and includes the following elements:
Volume Histograms:
Buy Volume: Represented by a green histogram. Shows the volume classified as "buy."
Sell Volume: Represented by a red histogram. Shows the volume classified as "sell."
Note: The histograms overlap, and the last plotted histogram (red) takes visual precedence, meaning the sell volume may cover the buy volume if it is larger.
Delta Line:
Delta Volume: Represented by a blue line. Shows the difference between buy and sell volume.
A line above zero indicates more buy volume; a line below zero indicates more sell volume.
A dashed gray horizontal line marks the zero level for easier interpretation.
Imbalance Backgrounds:
Buy Imbalance: Light green background when buy volume exceeds sell volume by the defined percentage.
Sell Imbalance: Light red background when sell volume exceeds buy volume by the defined percentage.
Divergence Backgrounds:
Positive Delta Divergence: Lime green background when a positive delta divergence is detected.
Negative Delta Divergence: Fuchsia background when a negative delta divergence is detected.
Trend Change Signals:
Bullish Signal: Green label with the text "Bullish Trend Change" when the conditions for a bullish trend change are met.
Bearish Signal: Red label with the text "Bearish Trend Change" when the conditions for a bearish trend change are met.
Information Labels:
Below each bar, a label displays:
Total Vol: The total volume of the bar.
Delta: The delta volume value.
Alerts
The indicator generates the following alerts:
Positive Delta Divergence: "Positive Delta Divergence Detected! Price is falling, but delta is increasing."
Negative Delta Divergence: "Negative Delta Divergence Detected! Price is rising, but delta is decreasing."
Bullish Trend Change Signal: "Bullish Trend Change Signal! Positive Delta Divergence, Delta Rise, Buy Imbalance, and Near Support."
Bearish Trend Change Signal: "Bearish Trend Change Signal! Negative Delta Divergence, Delta Drop, Sell Imbalance, and Near Resistance."
These alerts can be configured in TradingView to receive real-time notifications.
Adjustable Parameters
The indicator allows customization of the following parameters:
Imbalance Threshold (%): The percentage required to detect an imbalance between buy and sell volume (default is 300%).
Lookback Period for Divergence: Number of bars to look back for detecting price and delta trends (default is 2 bars).
Support/Resistance Lookback Period: Number of bars to look back for identifying historical support and resistance levels (default is 50 bars).
Delta High Threshold (Bearish): Minimum delta value 2 bars ago for the bearish signal (default is +500).
Delta Low Threshold (Bearish): Maximum delta value in the current bar for the bearish signal (default is -200).
Delta Low Threshold (Bullish): Maximum delta value 2 bars ago for the bullish signal (default is -500).
Delta High Threshold (Bullish): Minimum delta value in the current bar for the bullish signal (default is +200).
Practical Use
The indicator is useful for the following purposes:
Identifying Trend Changes:
The trend change signals (trendChangeBullish and trendChangeBearish) indicate potential price reversals. For example, a bullish signal near a support level may be an opportunity to enter a long position.
Detecting Divergences:
Delta divergences (positive and negative) can anticipate trend changes by showing a disagreement between price movement and underlying buying/selling pressure.
Finding Key Levels:
Imbalances (green and red backgrounds) often coincide with support and resistance levels, helping to identify areas where the market might react.
Confirming Trends:
A consistently positive delta in an uptrend or a negative delta in a downtrend can confirm the strength of the trend.
Identifying Failed Auctions:
Although not detected automatically, you can manually identify failed auctions by observing a price move to new highs/lows with decreasing volume in the direction of the move.
Limitations
Intrabar Data: It does not use detailed intrabar data, making it less precise than a native footprint chart.
Approximations: Volume classification and support/resistance detection are approximations, which may lead to false signals.
Volume Dependency: It requires reliable volume data, so it may be less effective on assets with inaccurate volume data (e.g., some forex pairs).
False Signals: Divergences and imbalances do not always indicate a trend change, especially in strongly trending markets.
Recommendations
Combine with Other Indicators: Use tools like RSI, MACD, support/resistance levels, or candlestick patterns to confirm signals.
Trade on Higher Timeframes: Signals are more reliable on higher timeframes like 1-hour or 4-hour charts.
Perform Backtesting: Evaluate the indicator's accuracy on historical data to adjust parameters and improve effectiveness.
Adjust Parameters: Modify thresholds (e.g., imbalanceThreshold or supportResistanceLookback) based on the asset and timeframe you are trading.
Conclusion
The "Volume Footprint Approximation" indicator is a powerful tool for analyzing volume dynamics and anticipating price trend changes. By classifying volume, calculating delta, detecting imbalances and divergences, and generating trend change signals, it provides traders with valuable insights into market buying and selling pressure. While it has limitations due to the lack of intrabar data, it can be highly effective when used in combination with other technical analysis tools and on assets with reliable volume data.

Buyer to Seller Volume (BSV) Indicator As promised, here is the buyer to seller volume indicator!
About it/How it works:
The indicator tracks buying and selling volume. It does it simplistically but effectively simply by looking at red vs green candles and averaging out the volume of each respective candle.
It uses the SMA of buying/selling and overall volume to track buyers to sellers and also display the average volume traded over a designated period of time.
Legend:
Green lines = buying volume
Red lines = selling volume
Yellow lines = SMA over designated period of time (user input defined, default is 14 candles).
Buyers are shown in green and sellers are shown in red:
How to Use it:
Default, the indicator goes to 1 Day, 14 candle period.
My preference personally is to use to have it go to "chart" but you can view any time period on the chart that you want and designate the time period of volume you want to view independently.
This can be used for:
1. Identify trends: When buying or selling volume is above selling volume and above the SMA, you know that this persuasively supports a bullish trend. Inverse for the opposite (see below):
2. To identify fakeouts and whether there is volume backing a move:
3. To identify potential changes in trends via a cross:
Its also a great reference when you are unsure of a move. This indicator literally just saved me from wrongfully shorting the FOMC bear flag today:
Probably many other uses you can find, but these are the things I like to use it for!
As always, I have posted a tutorial video for your reference:
As always though, if you have any questions, comments or suggestions for the indicator, please share them below!
Safe trades and best of luck to all!

BTC Fear & Greed Incremental StrategyIMPORTANT: READ SETUP GUIDE BELOW OR IT WON'T WORK
# BTC Fear & Greed Incremental Strategy — TradeMaster AI (Pure BTC Stack)
## Strategy Overview
This advanced Bitcoin accumulation strategy is designed for long-term hodlers who want to systematically take profits during greed cycles and accumulate during fear periods, while preserving their core BTC position. Unlike traditional strategies that start with cash, this approach begins with a specified BTC allocation, making it perfect for existing Bitcoin holders who want to optimize their stack management.
## Key Features
### 🎯 **Pure BTC Stack Mode**
- Start with any amount of BTC (configurable)
- Strategy manages your existing stack, not new purchases
- Perfect for hodlers who want to optimize without timing markets
### 📊 **Fear & Greed Integration**
- Uses market sentiment data to drive buy/sell decisions
- Configurable thresholds for greed (selling) and fear (buying) triggers
- Automatic validation to ensure proper 0-100 scale data source
### 🐂 **Bull Year Optimization**
- Smart quarterly selling during bull market years (2017, 2021, 2025)
- Q1: 1% sells, Q2: 2% sells, Q3/Q4: 5% sells (configurable)
- **NO SELLING** during non-bull years - pure accumulation mode
- Preserves BTC during early bull phases, maximizes profits at peaks
### 🐻 **Bear Market Intelligence**
- Multi-regime detection: Bull, Early Bear, Deep Bear, Early Bull
- Different buying strategies based on market conditions
- Enhanced buying during deep bear markets with configurable multipliers
- Visual regime backgrounds for easy market condition identification
### 🛡️ **Risk Management**
- Minimum BTC allocation floor (prevents selling entire stack)
- Configurable position sizing for all trades
- Multiple safety checks and validation
### 📈 **Advanced Visualization**
- Clean 0-100 scale with 2 decimal precision
- Three main indicators: BTC Allocation %, Fear & Greed Index, BTC Holdings
- Real-time portfolio tracking with cash position display
- Enhanced info table showing all key metrics
## How to Use
### **Step 1: Setup**
1. Add the strategy to your BTC/USD chart (daily timeframe recommended)
2. **CRITICAL**: In settings, change the "Fear & Greed Source" from "close" to a proper 0-100 Fear & Greed indicator
---------------
I recommend Crypto Fear & Greed Index by TIA_Technology indicator
When selecting source with this indicator, look for "Crypto Fear and Greed Index:Index"
---------------
3. Set your "Starting BTC Quantity" to match your actual holdings
4. Configure your preferred "Start Date" (when you want the strategy to begin)
### **Step 2: Configure Bull Year Logic**
- Enable "Bull Year Logic" (default: enabled)
- Adjust quarterly sell percentages:
- Q1 (Jan-Mar): 1% (conservative early bull)
- Q2 (Apr-Jun): 2% (moderate mid bull)
- Q3/Q4 (Jul-Dec): 5% (aggressive peak targeting)
- Add future bull years to the list as needed
### **Step 3: Fine-tune Thresholds**
- **Greed Threshold**: 80 (sell when F&G > 80)
- **Fear Threshold**: 20 (buy when F&G < 20 in bull markets)
- **Deep Bear Fear Threshold**: 25 (enhanced buying in bear markets)
- Adjust based on your risk tolerance
### **Step 4: Risk Management**
- Set "Minimum BTC Allocation %" (default 20%) - prevents selling entire stack
- Configure sell/buy percentages based on your position size
- Enable bear market filters for enhanced timing
### **Step 5: Monitor Performance**
- **Orange Line**: Your BTC allocation percentage (target: fluctuate between 20-100%)
- **Blue Line**: Actual BTC holdings (should preserve core position)
- **Pink Line**: Fear & Greed Index (drives all decisions)
- **Table**: Real-time portfolio metrics including cash position
## Reading the Indicators
### **BTC Allocation Percentage (Orange Line)**
- **100%**: All portfolio in BTC, no cash available for buying
- **80%**: 80% BTC, 20% cash ready for fear buying
- **20%**: Minimum allocation, maximum cash position
### **Trading Signals**
- **Green Buy Signals**: Appear during fear periods with available cash
- **Red Sell Signals**: Appear during greed periods in bull years only
- **No Signals**: Either allocation limits reached or non-bull year
## Strategy Logic
### **Bull Years (2017, 2021, 2025)**
- Q1: Conservative 1% sells (preserve stack for later)
- Q2: Moderate 2% sells (gradual profit taking)
- Q3/Q4: Aggressive 5% sells (peak targeting)
- Fear buying active (accumulate on dips)
### **Non-Bull Years**
- **Zero selling** - pure accumulation mode
- Enhanced fear buying during bear markets
- Focus on rebuilding stack for next bull cycle
## Important Notes
- **This is not financial advice** - backtest thoroughly before use
- Designed for **long-term holders** (4+ year cycles)
- **Requires proper Fear & Greed data source** - validate in settings
- Best used on **daily timeframe** for major trend following
- **Cash calculations**: Use allocation % and BTC holdings to calculate available cash: `Cash = (Total Portfolio × (1 - Allocation%/100))`
## Risk Disclaimer
This strategy involves active trading and position management. Past performance does not guarantee future results. Always do your own research and never invest more than you can afford to lose. The strategy is designed for educational purposes and long-term Bitcoin accumulation thesis.
---
*Developed by Sol_Crypto for the Bitcoin community. Happy stacking! 🚀*

Ultimate RSI [captainua]Ultimate RSI
Overview
This indicator combines multiple RSI calculations with volume analysis, divergence detection, and trend filtering to provide a comprehensive RSI-based trading system. The script calculates RSI using three different periods (6, 14, 24) and applies various smoothing methods to reduce noise while maintaining responsiveness. The combination of these features creates a multi-layered confirmation system that reduces false signals by requiring alignment across multiple indicators and timeframes.
The script includes optimized configuration presets for instant setup: Scalping, Day Trading, Swing Trading, and Position Trading. Simply select a preset to instantly configure all settings for your trading style, or use Custom mode for full manual control. All settings include automatic input validation to prevent configuration errors and ensure optimal performance.
Configuration Presets
The script includes preset configurations optimized for different trading styles, allowing you to instantly configure the indicator for your preferred trading approach. Simply select a preset from the "Configuration Preset" dropdown menu:
- Scalping: Optimized for fast-paced trading with shorter RSI periods (4, 7, 9) and minimal smoothing. Noise reduction is automatically disabled, and momentum confirmation is disabled to allow faster signal generation. Designed for quick entries and exits in volatile markets.
- Day Trading: Balanced configuration for intraday trading with moderate RSI periods (6, 9, 14) and light smoothing. Momentum confirmation is enabled for better signal quality. Ideal for day trading strategies requiring timely but accurate signals.
- Swing Trading: Configured for medium-term positions with standard RSI periods (14, 14, 21) and moderate smoothing. Provides smoother signals suitable for swing trading timeframes. All noise reduction features remain active.
- Position Trading: Optimized for longer-term trades with extended RSI periods (24, 21, 28) and heavier smoothing. Filters are configured for highest-quality signals. Best for position traders holding trades over multiple days or weeks.
- Custom: Full manual control over all settings. All input parameters are available for complete customization. This is the default mode and maintains full backward compatibility with previous versions.
When a preset is selected, it automatically adjusts RSI periods, smoothing lengths, and filter settings to match the trading style. The preset configurations ensure optimal settings are applied instantly, eliminating the need for manual configuration. All settings can still be manually overridden if needed, providing flexibility while maintaining ease of use.
Input Validation and Error Prevention
The script includes comprehensive input validation to prevent configuration errors:
- Cross-Input Validation: Smoothing lengths are automatically validated to ensure they are always less than their corresponding RSI period length. If you set a smoothing length greater than or equal to the RSI length, the script automatically adjusts it to (RSI Length - 1). This prevents logical errors and ensures valid configurations.
- Input Range Validation: All numeric inputs have minimum and maximum value constraints enforced by TradingView's input system, preventing invalid parameter values.
- Smart Defaults: Preset configurations use validated default values that are tested and optimized for each trading style. When switching between presets, all related settings are automatically updated to maintain consistency.
Core Calculations
Multi-Period RSI:
The script calculates RSI using the standard Wilder's RSI formula: RSI = 100 - (100 / (1 + RS)), where RS = Average Gain / Average Loss over the specified period. Three separate RSI calculations run simultaneously:
- RSI(6): Uses 6-period lookback for high sensitivity to recent price changes, useful for scalping and early signal detection
- RSI(14): Standard 14-period RSI for balanced analysis, the most commonly used RSI period
- RSI(24): Longer 24-period RSI for trend confirmation, provides smoother signals with less noise
Each RSI can be smoothed using EMA, SMA, RMA (Wilder's smoothing), WMA, or Zero-Lag smoothing. Zero-Lag smoothing uses the formula: ZL-RSI = RSI + (RSI - RSI ) to reduce lag while maintaining signal quality. You can apply individual smoothing lengths to each RSI period, or use global smoothing where all three RSIs share the same smoothing length.
Dynamic Overbought/Oversold Thresholds:
Static thresholds (default 70/30) are adjusted based on market volatility using ATR. The formula: Dynamic OB = Base OB + (ATR × Volatility Multiplier × Base Percentage / 100), Dynamic OS = Base OS - (ATR × Volatility Multiplier × Base Percentage / 100). This adapts to volatile markets where traditional 70/30 levels may be too restrictive. During high volatility, the dynamic thresholds widen, and during low volatility, they narrow. The thresholds are clamped between 0-100 to remain within RSI bounds. The ATR is cached for performance optimization, updating on confirmed bars and real-time bars.
Adaptive RSI Calculation:
An adaptive RSI adjusts the standard RSI(14) based on current volatility relative to average volatility. The calculation: Adaptive Factor = (Current ATR / SMA of ATR over 20 periods) × Volatility Multiplier. If SMA of ATR is zero (edge case), the adaptive factor defaults to 0. The adaptive RSI = Base RSI × (1 + Adaptive Factor), clamped to 0-100. This makes the indicator more responsive during high volatility periods when traditional RSI may lag. The adaptive RSI is used for signal generation (buy/sell signals) but is not plotted on the chart.
Overbought/Oversold Fill Zones:
The script provides visual fill zones between the RSI line and the threshold lines when RSI is in overbought or oversold territory. The fill logic uses inclusive conditions: fills are shown when RSI is currently in the zone OR was in the zone on the previous bar. This ensures complete coverage of entry and exit boundaries. A minimum gap of 0.1 RSI points is maintained between the RSI plot and threshold line to ensure reliable polygon rendering in TradingView. The fill uses invisible plots at the threshold levels and the RSI value, with the fill color applied between them. You can select which RSI (6, 14, or 24) to use for the fill zones.
Divergence Detection
Regular Divergence:
Bullish divergence: Price makes a lower low (current low < lowest low from previous lookback period) while RSI makes a higher low (current RSI > lowest RSI from previous lookback period). Bearish divergence: Price makes a higher high (current high > highest high from previous lookback period) while RSI makes a lower high (current RSI < highest RSI from previous lookback period). The script compares current price/RSI values to the lowest/highest values from the previous lookback period using ta.lowest() and ta.highest() functions with index to reference the previous period's extreme.
Pivot-Based Divergence:
An enhanced divergence detection method that uses actual pivot points instead of simple lowest/highest comparisons. This provides more accurate divergence detection by identifying significant pivot lows/highs in both price and RSI. The pivot-based method uses a tolerance-based approach with configurable constants: 1% tolerance for price comparisons (priceTolerancePercent = 0.01) and 1.0 RSI point absolute tolerance for RSI comparisons (pivotTolerance = 1.0). Minimum divergence threshold is 1.0 RSI point (minDivergenceThreshold = 1.0). It looks for two recent pivot points and compares them: for bullish divergence, price makes a lower low (at least 1% lower) while RSI makes a higher low (at least 1.0 point higher). This method reduces false divergences by requiring actual pivot points rather than just any low/high within a period. When enabled, pivot-based divergence replaces the traditional method for more accurate signal generation.
Strong Divergence:
Regular divergence is confirmed by an engulfing candle pattern. Bullish engulfing requires: (1) Previous candle is bearish (close < open ), (2) Current candle is bullish (close > open), (3) Current close > previous open, (4) Current open < previous close. Bearish engulfing is the inverse: previous bullish, current bearish, current close < previous open, current open > previous close. Strong divergence signals are marked with visual indicators (🐂 for bullish, 🐻 for bearish) and have separate alert conditions.
Hidden Divergence:
Continuation patterns that signal trend continuation rather than reversal. Bullish hidden divergence: Price makes a higher low (current low > lowest low from previous period) but RSI makes a lower low (current RSI < lowest RSI from previous period). Bearish hidden divergence: Price makes a lower high (current high < highest high from previous period) but RSI makes a higher high (current RSI > highest RSI from previous period). These patterns indicate the trend is likely to continue in the current direction.
Volume Confirmation System
Volume threshold filtering requires current volume to exceed the volume SMA multiplied by the threshold factor. The formula: Volume Confirmed = Volume > (Volume SMA × Threshold). If the threshold is set to 0.1 or lower, volume confirmation is effectively disabled (always returns true). This allows you to use the indicator without volume filtering if desired.
Volume Climax is detected when volume exceeds: Volume SMA + (Volume StdDev × Multiplier). This indicates potential capitulation moments where extreme volume accompanies price movements. Volume Dry-Up is detected when volume falls below: Volume SMA - (Volume StdDev × Multiplier), indicating low participation periods that may produce unreliable signals. The volume SMA is cached for performance, updating on confirmed and real-time bars.
Multi-RSI Synergy
The script generates signals when multiple RSI periods align in overbought or oversold zones. This creates a confirmation system that reduces false signals. In "ALL" mode, all three RSIs (6, 14, 24) must be simultaneously above the overbought threshold OR all three must be below the oversold threshold. In "2-of-3" mode, any two of the three RSIs must align in the same direction. The script counts how many RSIs are in each zone: twoOfThreeOB = ((rsi6OB ? 1 : 0) + (rsi14OB ? 1 : 0) + (rsi24OB ? 1 : 0)) >= 2.
Synergy signals require: (1) Multi-RSI alignment (ALL or 2-of-3), (2) Volume confirmation, (3) Reset condition satisfied (enough bars since last synergy signal), (4) Additional filters passed (RSI50, Trend, ADX, Volume Dry-Up avoidance). Separate reset conditions track buy and sell signals independently. The reset condition uses ta.barssince() to count bars since the last trigger, returning true if the condition never occurred (allowing first signal) or if enough bars have passed.
Regression Forecasting
The script uses historical RSI values to forecast future RSI direction using four methods. The forecast horizon is configurable (1-50 bars ahead). Historical data is collected into an array, and regression coefficients are calculated based on the selected method.
Linear Regression: Calculates the least-squares fit line (y = mx + b) through the last N RSI values. The calculation: meanX = sumX / horizon, meanY = sumY / horizon, denominator = sumX² - horizon × meanX², m = (sumXY - horizon × meanX × meanY) / denominator, b = meanY - m × meanX. The forecast projects this line forward: forecast = b + m × i for i = 1 to horizon.
Polynomial Regression: Fits a quadratic curve (y = ax² + bx + c) to capture non-linear trends. The system of equations is solved using Cramer's rule with a 3×3 determinant. If the determinant is too small (< 0.0001), the system falls back to linear regression. Coefficients are calculated by solving: n×c + sumX×b + sumX²×a = sumY, sumX×c + sumX²×b + sumX³×a = sumXY, sumX²×c + sumX³×b + sumX⁴×a = sumX²Y. Note: Due to the O(n³) computational complexity of polynomial regression, the forecast horizon is automatically limited to a maximum of 20 bars when using polynomial regression to maintain optimal performance. If you set a horizon greater than 20 bars with polynomial regression, it will be automatically capped at 20 bars.
Exponential Smoothing: Applies exponential smoothing with adaptive alpha = 2/(horizon+1). The smoothing iterates from oldest to newest value: smoothed = alpha × series + (1 - alpha) × smoothed. Trend is calculated by comparing current smoothed value to an earlier smoothed value (at 60% of horizon): trend = (smoothed - earlierSmoothed) / (horizon - earlierIdx). Forecast: forecast = base + trend × i.
Moving Average: Uses the difference between short MA (horizon/2) and long MA (horizon) to estimate trend direction. Trend = (maShort - maLong) / (longLen - shortLen). Forecast: forecast = maShort + trend × i.
Confidence bands are calculated using RMSE (Root Mean Squared Error) of historical forecast accuracy. The error calculation compares historical values with forecast values: RMSE = sqrt(sumSquaredError / count). If insufficient data exists, it falls back to calculating standard deviation of recent RSI values. Confidence bands = forecast ± (RMSE × confidenceLevel). All forecast values and confidence bands are clamped to 0-100 to remain within RSI bounds. The regression functions include comprehensive safety checks: horizon validation (must not exceed array size), empty array handling, edge case handling for horizon=1 scenarios, division-by-zero protection, and bounds checking for all array access operations to prevent runtime errors.
Strong Top/Bottom Detection
Strong buy signals require three conditions: (1) RSI is at its lowest point within the bottom period: rsiVal <= ta.lowest(rsiVal, bottomPeriod), (2) RSI is below the oversold threshold minus a buffer: rsiVal < (oversoldThreshold - rsiTopBottomBuffer), where rsiTopBottomBuffer = 2.0 RSI points, (3) The absolute difference between current RSI and the lowest RSI exceeds the threshold value: abs(rsiVal - ta.lowest(rsiVal, bottomPeriod)) > threshold. This indicates a bounce from extreme levels with sufficient distance from the absolute low.
Strong sell signals use the inverse logic: RSI at highest point, above overbought threshold + rsiTopBottomBuffer (2.0 RSI points), and difference from highest exceeds threshold. Both signals also require: volume confirmation, reset condition satisfied (separate reset for buy vs sell), and all additional filters passed (RSI50, Trend, ADX, Volume Dry-Up avoidance).
The reset condition uses separate logic for buy and sell: resetCondBuy checks bars since isRSIAtBottom, resetCondSell checks bars since isRSIAtTop. This ensures buy signals reset based on bottom conditions and sell signals reset based on top conditions, preventing incorrect signal blocking.
Filtering System
RSI(50) Filter: Only allows buy signals when RSI(14) > 50 (bullish momentum) and sell signals when RSI(14) < 50 (bearish momentum). This filter ensures you're buying in uptrends and selling in downtrends from a momentum perspective. The filter is optional and can be disabled. Recommended to enable for noise reduction.
Trend Filter: Uses a long-term EMA (default 200) to determine trend direction. Buy signals require price above EMA, sell signals require price below EMA. The EMA slope is calculated as: emaSlope = ema - ema . Optional EMA slope filter additionally requires the EMA to be rising (slope > 0) for buy signals or falling (slope < 0) for sell signals. This provides stronger trend confirmation by requiring both price position and EMA direction.
ADX Filter: Uses the Directional Movement Index (calculated via ta.dmi()) to measure trend strength. Signals only fire when ADX exceeds the threshold (default 20), indicating a strong trend rather than choppy markets. The ADX calculation uses separate length and smoothing parameters. This filter helps avoid signals during sideways/consolidation periods.
Volume Dry-Up Avoidance: Prevents signals during periods of extremely low volume relative to average. If volume dry-up is detected and the filter is enabled, signals are blocked. This helps avoid unreliable signals that occur during low participation periods.
RSI Momentum Confirmation: Requires RSI to be accelerating in the signal direction before confirming signals. For buy signals, RSI must be consistently rising (recovering from oversold) over the lookback period. For sell signals, RSI must be consistently falling (declining from overbought) over the lookback period. The momentum check verifies that all consecutive changes are in the correct direction AND the cumulative change is significant. This filter ensures signals only fire when RSI momentum aligns with the signal direction, reducing false signals from weak momentum.
Multi-Timeframe Confirmation: Requires higher timeframe RSI to align with the signal direction. For buy signals, current RSI must be below the higher timeframe RSI by at least the confirmation threshold. For sell signals, current RSI must be above the higher timeframe RSI by at least the confirmation threshold. This ensures signals align with the larger trend context, reducing counter-trend trades. The higher timeframe RSI is fetched using request.security() from the selected timeframe.
All filters use the pattern: filterResult = not filterEnabled OR conditionMet. This means if a filter is disabled, it always passes (returns true). Filters can be combined, and all must pass for a signal to fire.
RSI Centerline and Period Crossovers
RSI(50) Centerline Crossovers: Detects when the selected RSI source crosses above or below the 50 centerline. Bullish crossover: ta.crossover(rsiSource, 50), bearish crossover: ta.crossunder(rsiSource, 50). You can select which RSI (6, 14, or 24) to use for these crossovers. These signals indicate momentum shifts from bearish to bullish (above 50) or bullish to bearish (below 50).
RSI Period Crossovers: Detects when different RSI periods cross each other. Available pairs: RSI(6) × RSI(14), RSI(14) × RSI(24), or RSI(6) × RSI(24). Bullish crossover: fast RSI crosses above slow RSI (ta.crossover(rsiFast, rsiSlow)), indicating momentum acceleration. Bearish crossover: fast RSI crosses below slow RSI (ta.crossunder(rsiFast, rsiSlow)), indicating momentum deceleration. These crossovers can signal shifts in momentum before price moves.
StochRSI Calculation
Stochastic RSI applies the Stochastic oscillator formula to RSI values instead of price. The calculation: %K = ((RSI - Lowest RSI) / (Highest RSI - Lowest RSI)) × 100, where the lookback is the StochRSI length. If the range is zero, %K defaults to 50.0. %K is then smoothed using SMA with the %K smoothing length. %D is calculated as SMA of smoothed %K with the %D smoothing length. All values are clamped to 0-100. You can select which RSI (6, 14, or 24) to use as the source for StochRSI calculation.
RSI Bollinger Bands
Bollinger Bands are applied to RSI(14) instead of price. The calculation: Basis = SMA(RSI(14), BB Period), StdDev = stdev(RSI(14), BB Period), Upper = Basis + (StdDev × Deviation Multiplier), Lower = Basis - (StdDev × Deviation Multiplier). This creates dynamic zones around RSI that adapt to RSI volatility. When RSI touches or exceeds the bands, it indicates extreme conditions relative to recent RSI behavior.
Noise Reduction System
The script includes a comprehensive noise reduction system to filter false signals and improve accuracy. When enabled, signals must pass multiple quality checks:
Signal Strength Requirement: RSI must be at least X points away from the centerline (50). For buy signals, RSI must be at least X points below 50. For sell signals, RSI must be at least X points above 50. This ensures signals only trigger when RSI is significantly in oversold/overbought territory, not just near neutral.
Extreme Zone Requirement: RSI must be deep in the OB/OS zone. For buy signals, RSI must be at least X points below the oversold threshold. For sell signals, RSI must be at least X points above the overbought threshold. This ensures signals only fire in extreme conditions where reversals are more likely.
Consecutive Bar Confirmation: The signal condition must persist for N consecutive bars before triggering. This reduces false signals from single-bar spikes or noise. The confirmation checks that the signal condition was true for all bars in the lookback period.
Zone Persistence (Optional): Requires RSI to remain in the OB/OS zone for N consecutive bars, not just touch it. This ensures RSI is truly in an extreme state rather than just briefly touching the threshold. When enabled, this provides stricter filtering for higher-quality signals.
RSI Slope Confirmation (Optional): Requires RSI to be moving in the expected signal direction. For buy signals, RSI should be rising (recovering from oversold). For sell signals, RSI should be falling (declining from overbought). This ensures momentum is aligned with the signal direction. The slope is calculated by comparing current RSI to RSI N bars ago.
All noise reduction filters can be enabled/disabled independently, allowing you to customize the balance between signal frequency and accuracy. The default settings provide a good balance, but you can adjust them based on your trading style and market conditions.
Alert System
The script includes separate alert conditions for each signal type: buy/sell (adaptive RSI crossovers), divergence (regular, strong, hidden), crossovers (RSI50 centerline, RSI period crossovers), synergy signals, and trend breaks. Each alert type has its own alertcondition() declaration with a unique title and message.
An optional cooldown system prevents alert spam by requiring a minimum number of bars between alerts of the same type. The cooldown check: canAlert = na(lastAlertBar) OR (bar_index - lastAlertBar >= cooldownBars). If the last alert bar is na (first alert), it always allows the alert. Each alert type maintains its own lastAlertBar variable, so cooldowns are independent per signal type. The default cooldown is 10 bars, which is recommended for noise reduction.
Higher Timeframe RSI
The script can display RSI from a higher timeframe using request.security(). This allows you to see the RSI context from a larger timeframe (e.g., daily RSI on an hourly chart). The higher timeframe RSI uses RSI(14) calculation from the selected timeframe. This provides context for the current timeframe's RSI position relative to the larger trend.
RSI Pivot Trendlines
The script can draw trendlines connecting pivot highs and lows on RSI(6). This feature helps visualize RSI trends and identify potential trend breaks.
Pivot Detection: Pivots are detected using a configurable period. The script can require pivots to have minimum strength (RSI points difference from surrounding bars) to filter out weak pivots. Lower minPivotStrength values detect more pivots (more trendlines), while higher values detect only stronger pivots (fewer but more significant trendlines). Pivot confirmation is optional: when enabled, the script waits N bars to confirm the pivot remains the extreme, reducing repainting. Pivot confirmation functions (f_confirmPivotLow and f_confirmPivotHigh) are always called on every bar for consistency, as recommended by TradingView. When pivot bars are not available (na), safe default values are used, and the results are then used conditionally based on confirmation settings. This ensures consistent calculations and prevents calculation inconsistencies.
Trendline Drawing: Uptrend lines connect confirmed pivot lows (green), and downtrend lines connect confirmed pivot highs (red). By default, only the most recent trendline is shown (old trendlines are deleted when new pivots are confirmed). This keeps the chart clean and uncluttered. If "Keep Historical Trendlines" is enabled, the script preserves up to N historical trendlines (configurable via "Max Trendlines to Keep", default 5). When historical trendlines are enabled, old trendlines are saved to arrays instead of being deleted, allowing you to see multiple trendlines simultaneously for better trend analysis. The arrays are automatically limited to prevent memory accumulation.
Trend Break Detection: Signals are generated when RSI breaks above or below trendlines. Uptrend breaks (RSI crosses below uptrend line) generate buy signals. Downtrend breaks (RSI crosses above downtrend line) generate sell signals. Optional trend break confirmation requires the break to persist for N bars and optionally include volume confirmation. Trendline angle filtering can exclude flat/weak trendlines from generating signals (minTrendlineAngle > 0 filters out weak/flat trendlines).
How Components Work Together
The combination of multiple RSI periods provides confirmation across different timeframes, reducing false signals. RSI(6) catches early moves, RSI(14) provides balanced signals, and RSI(24) confirms longer-term trends. When all three align (synergy), it indicates strong consensus across timeframes.
Volume confirmation ensures signals occur with sufficient market participation, filtering out low-volume false breakouts. Volume climax detection identifies potential reversal points, while volume dry-up avoidance prevents signals during unreliable low-volume periods.
Trend filters align signals with the overall market direction. The EMA filter ensures you're trading with the trend, and the EMA slope filter adds an additional layer by requiring the trend to be strengthening (rising EMA for buys, falling EMA for sells).
ADX filter ensures signals only fire during strong trends, avoiding choppy/consolidation periods. RSI(50) filter ensures momentum alignment with the trade direction.
Momentum confirmation requires RSI to be accelerating in the signal direction, ensuring signals only fire when momentum is aligned. Multi-timeframe confirmation ensures signals align with higher timeframe trends, reducing counter-trend trades.
Divergence detection identifies potential reversals before they occur, providing early warning signals. Pivot-based divergence provides more accurate detection by using actual pivot points. Hidden divergence identifies continuation patterns, useful for trend-following strategies.
The noise reduction system combines multiple filters (signal strength, extreme zone, consecutive bars, zone persistence, RSI slope) to significantly reduce false signals. These filters work together to ensure only high-quality signals are generated.
The synergy system requires alignment across all RSI periods for highest-quality signals, significantly reducing false positives. Regression forecasting provides forward-looking context, helping anticipate potential RSI direction changes.
Pivot trendlines provide visual trend analysis and can generate signals when RSI breaks trendlines, indicating potential reversals or continuations.
Reset conditions prevent signal spam by requiring a minimum number of bars between signals. Separate reset conditions for buy and sell signals ensure proper signal management.
Usage Instructions
Configuration Presets (Recommended): The script includes optimized preset configurations for instant setup. Simply select your trading style from the "Configuration Preset" dropdown:
- Scalping Preset: RSI(4, 7, 9) with minimal smoothing. Noise reduction disabled, momentum confirmation disabled for fastest signals.
- Day Trading Preset: RSI(6, 9, 14) with light smoothing. Momentum confirmation enabled for better signal quality.
- Swing Trading Preset: RSI(14, 14, 21) with moderate smoothing. Balanced configuration for medium-term trades.
- Position Trading Preset: RSI(24, 21, 28) with heavier smoothing. Optimized for longer-term positions with all filters active.
- Custom Mode: Full manual control over all settings. Default behavior matches previous script versions.
Presets automatically configure RSI periods, smoothing lengths, and filter settings. You can still manually adjust any setting after selecting a preset if needed.
Getting Started: The easiest way to get started is to select a configuration preset matching your trading style (Scalping, Day Trading, Swing Trading, or Position Trading) from the "Configuration Preset" dropdown. This instantly configures all settings for optimal performance. Alternatively, use "Custom" mode for full manual control. The default configuration (Custom mode) shows RSI(6), RSI(14), and RSI(24) with their default smoothing. Overbought/oversold fill zones are enabled by default.
Customizing RSI Periods: Adjust the RSI lengths (6, 14, 24) based on your trading timeframe. Shorter periods (6) for scalping, standard (14) for day trading, longer (24) for swing trading. You can disable any RSI period you don't need.
Smoothing Selection: Choose smoothing method based on your needs. EMA provides balanced smoothing, RMA (Wilder's) is traditional, Zero-Lag reduces lag but may increase noise. Adjust smoothing lengths individually or use global smoothing for consistency. Note: Smoothing lengths are automatically validated to ensure they are always less than the corresponding RSI period length. If you set smoothing >= RSI length, it will be auto-adjusted to prevent invalid configurations.
Dynamic OB/OS: The dynamic thresholds automatically adapt to volatility. Adjust the volatility multiplier and base percentage to fine-tune sensitivity. Higher values create wider thresholds in volatile markets.
Volume Confirmation: Set volume threshold to 1.2 (default) for standard confirmation, higher for stricter filtering, or 0.1 to disable volume filtering entirely.
Multi-RSI Synergy: Use "ALL" mode for highest-quality signals (all 3 RSIs must align), or "2-of-3" mode for more frequent signals. Adjust the reset period to control signal frequency.
Filters: Enable filters gradually to find your preferred balance. Start with volume confirmation, then add trend filter, then ADX for strongest confirmation. RSI(50) filter is useful for momentum-based strategies and is recommended for noise reduction. Momentum confirmation and multi-timeframe confirmation add additional layers of accuracy but may reduce signal frequency.
Noise Reduction: The noise reduction system is enabled by default with balanced settings. Adjust minSignalStrength (default 3.0) to control how far RSI must be from centerline. Increase requireConsecutiveBars (default 1) to require signals to persist longer. Enable requireZonePersistence and requireRsiSlope for stricter filtering (higher quality but fewer signals). Start with defaults and adjust based on your needs.
Divergence: Enable divergence detection and adjust lookback periods. Strong divergence (with engulfing confirmation) provides higher-quality signals. Hidden divergence is useful for trend-following strategies. Enable pivot-based divergence for more accurate detection using actual pivot points instead of simple lowest/highest comparisons. Pivot-based divergence uses tolerance-based matching (1% for price, 1.0 RSI point for RSI) for better accuracy.
Forecasting: Enable regression forecasting to see potential RSI direction. Linear regression is simplest, polynomial captures curves, exponential smoothing adapts to trends. Adjust horizon based on your trading timeframe. Confidence bands show forecast uncertainty - wider bands indicate less reliable forecasts.
Pivot Trendlines: Enable pivot trendlines to visualize RSI trends and identify trend breaks. Adjust pivot detection period (default 5) - higher values detect fewer but stronger pivots. Enable pivot confirmation (default ON) to reduce repainting. Set minPivotStrength (default 1.0) to filter weak pivots - lower values detect more pivots (more trendlines), higher values detect only stronger pivots (fewer trendlines). Enable "Keep Historical Trendlines" to preserve multiple trendlines instead of just the most recent one. Set "Max Trendlines to Keep" (default 5) to control how many historical trendlines are preserved. Enable trend break confirmation for more reliable break signals. Adjust minTrendlineAngle (default 0.0) to filter flat trendlines - set to 0.1-0.5 to exclude weak trendlines.
Alerts: Set up alerts for your preferred signal types. Enable cooldown to prevent alert spam. Each signal type has its own alert condition, so you can be selective about which signals trigger alerts.
Visual Elements and Signal Markers
The script uses various visual markers to indicate signals and conditions:
- "sBottom" label (green): Strong bottom signal - RSI at extreme low with strong buy conditions
- "sTop" label (red): Strong top signal - RSI at extreme high with strong sell conditions
- "SyBuy" label (lime): Multi-RSI synergy buy signal - all RSIs aligned oversold
- "SySell" label (red): Multi-RSI synergy sell signal - all RSIs aligned overbought
- 🐂 emoji (green): Strong bullish divergence detected
- 🐻 emoji (red): Strong bearish divergence detected
- 🔆 emoji: Weak divergence signals (if enabled)
- "H-Bull" label: Hidden bullish divergence
- "H-Bear" label: Hidden bearish divergence
- ⚡ marker (top of pane): Volume climax detected (extreme volume) - positioned at top for visibility
- 💧 marker (top of pane): Volume dry-up detected (very low volume) - positioned at top for visibility
- ↑ triangle (lime): Uptrend break signal - RSI breaks below uptrend line
- ↓ triangle (red): Downtrend break signal - RSI breaks above downtrend line
- Triangle up (lime): RSI(50) bullish crossover
- Triangle down (red): RSI(50) bearish crossover
- Circle markers: RSI period crossovers
All markers are positioned at the RSI value where the signal occurs, using location.absolute for precise placement.
Signal Priority and Interpretation
Signals are generated independently and can occur simultaneously. Higher-priority signals generally indicate stronger setups:
1. Multi-RSI Synergy signals (SyBuy/SySell) - Highest priority: Requires alignment across all RSI periods plus volume and filter confirmation. These are the most reliable signals.
2. Strong Top/Bottom signals (sTop/sBottom) - High priority: Indicates extreme RSI levels with strong bounce conditions. Requires volume confirmation and all filters.
3. Divergence signals - Medium-High priority: Strong divergence (with engulfing) is more reliable than regular divergence. Hidden divergence indicates continuation rather than reversal.
4. Adaptive RSI crossovers - Medium priority: Buy when adaptive RSI crosses below dynamic oversold, sell when it crosses above dynamic overbought. These use volatility-adjusted RSI for more accurate signals.
5. RSI(50) centerline crossovers - Medium priority: Momentum shift signals. Less reliable alone but useful when combined with other confirmations.
6. RSI period crossovers - Lower priority: Early momentum shift indicators. Can provide early warning but may produce false signals in choppy markets.
Best practice: Wait for multiple confirmations. For example, a synergy signal combined with divergence and volume climax provides the strongest setup.
Chart Requirements
For proper script functionality and compliance with TradingView requirements, ensure your chart displays:
- Symbol name: The trading pair or instrument name should be visible
- Timeframe: The chart timeframe should be clearly displayed
- Script name: "Ultimate RSI " should be visible in the indicator title
These elements help traders understand what they're viewing and ensure proper script identification. The script automatically includes this information in the indicator title and chart labels.
Performance Considerations
The script is optimized for performance:
- ATR and Volume SMA are cached using var variables, updating only on confirmed and real-time bars to reduce redundant calculations
- Forecast line arrays are dynamically managed: lines are reused when possible, and unused lines are deleted to prevent memory accumulation
- Calculations use efficient Pine Script functions (ta.rsi, ta.ema, etc.) which are optimized by TradingView
- Array operations are minimized where possible, with direct calculations preferred
- Polynomial regression automatically caps the forecast horizon at 20 bars (POLYNOMIAL_MAX_HORIZON constant) to prevent performance degradation, as polynomial regression has O(n³) complexity. This safeguard ensures optimal performance even with large horizon settings
- Pivot detection includes edge case handling to ensure reliable calculations even on early bars with limited historical data. Regression forecasting functions include comprehensive safety checks: horizon validation (must not exceed array size), empty array handling, edge case handling for horizon=1 scenarios, and division-by-zero protection in all mathematical operations
The script should perform well on all timeframes. On very long historical data, forecast lines may accumulate if the horizon is large; consider reducing the forecast horizon if you experience performance issues. The polynomial regression performance safeguard automatically prevents performance issues for that specific regression type.
Known Limitations and Considerations
- Forecast lines are forward-looking projections and should not be used as definitive predictions. They provide context but are not guaranteed to be accurate.
- Dynamic OB/OS thresholds can exceed 100 or go below 0 in extreme volatility scenarios, but are clamped to 0-100 range. This means in very volatile markets, the dynamic thresholds may not widen as much as the raw calculation suggests.
- Volume confirmation requires sufficient historical volume data. On new instruments or very short timeframes, volume calculations may be less reliable.
- Higher timeframe RSI uses request.security() which may have slight delays on some data feeds.
- Regression forecasting requires at least N bars of history (where N = forecast horizon) before it can generate forecasts. Early bars will not show forecast lines.
- StochRSI calculation requires the selected RSI source to have sufficient history. Very short RSI periods on new charts may produce less reliable StochRSI values initially.
Practical Use Cases
The indicator can be configured for different trading styles and timeframes:
Swing Trading: Select the "Swing Trading" preset for instant optimal configuration. This preset uses RSI periods (14, 14, 21) with moderate smoothing. Alternatively, manually configure: Use RSI(24) with Multi-RSI Synergy in "ALL" mode, combined with trend filter (EMA 200) and ADX filter. This configuration provides high-probability setups with strong confirmation across multiple RSI periods.
Day Trading: Select the "Day Trading" preset for instant optimal configuration. This preset uses RSI periods (6, 9, 14) with light smoothing and momentum confirmation enabled. Alternatively, manually configure: Use RSI(6) with Zero-Lag smoothing for fast signal detection. Enable volume confirmation with threshold 1.2-1.5 for reliable entries. Combine with RSI(50) filter to ensure momentum alignment. Strong top/bottom signals work well for day trading reversals.
Trend Following: Enable trend filter (EMA) and EMA slope filter for strong trend confirmation. Use RSI(14) or RSI(24) with ADX filter to avoid choppy markets. Hidden divergence signals are useful for trend continuation entries.
Reversal Trading: Focus on divergence detection (regular and strong) combined with strong top/bottom signals. Enable volume climax detection to identify capitulation moments. Use RSI(6) for early reversal signals, confirmed by RSI(14) and RSI(24).
Forecasting and Planning: Enable regression forecasting with polynomial or exponential smoothing methods. Use forecast horizon of 10-20 bars for swing trading, 5-10 bars for day trading. Confidence bands help assess forecast reliability.
Multi-Timeframe Analysis: Enable higher timeframe RSI to see context from larger timeframes. For example, use daily RSI on hourly charts to understand the larger trend context. This helps avoid counter-trend trades.
Scalping: Select the "Scalping" preset for instant optimal configuration. This preset uses RSI periods (4, 7, 9) with minimal smoothing, disables noise reduction, and disables momentum confirmation for faster signals. Alternatively, manually configure: Use RSI(6) with minimal smoothing (or Zero-Lag) for ultra-fast signals. Disable most filters except volume confirmation. Use RSI period crossovers (RSI(6) × RSI(14)) for early momentum shifts. Set volume threshold to 1.0-1.2 for less restrictive filtering.
Position Trading: Select the "Position Trading" preset for instant optimal configuration. This preset uses extended RSI periods (24, 21, 28) with heavier smoothing, optimized for longer-term trades. Alternatively, manually configure: Use RSI(24) with all filters enabled (Trend, ADX, RSI(50), Volume Dry-Up avoidance). Multi-RSI Synergy in "ALL" mode provides highest-quality signals.
Practical Tips and Best Practices
Getting Started: The fastest way to get started is to select a configuration preset that matches your trading style. Simply choose "Scalping", "Day Trading", "Swing Trading", or "Position Trading" from the "Configuration Preset" dropdown to instantly configure all settings optimally. For advanced users, use "Custom" mode for full manual control. The default configuration (Custom mode) is balanced and works well across different markets. After observing behavior, customize settings to match your trading style.
Reducing Repainting: All signals are based on confirmed bars, minimizing repainting. The script uses confirmed bar data for all calculations to ensure backtesting accuracy.
Signal Quality: Multi-RSI Synergy signals in "ALL" mode provide the highest-quality signals because they require alignment across all three RSI periods. These signals have lower frequency but higher reliability. For more frequent signals, use "2-of-3" mode. The noise reduction system further improves signal quality by requiring multiple confirmations (signal strength, extreme zone, consecutive bars, optional zone persistence and RSI slope). Adjust noise reduction settings to balance signal frequency vs. accuracy.
Filter Combinations: Start with volume confirmation, then add trend filter for trend alignment, then ADX filter for trend strength. Combining all three filters significantly reduces false signals but also reduces signal frequency. Find your balance based on your risk tolerance.
Volume Filtering: Set volume threshold to 0.1 or lower to effectively disable volume filtering if you trade instruments with unreliable volume data or want to test without volume confirmation. Standard confirmation uses 1.2-1.5 threshold.
RSI Period Selection: RSI(6) is most sensitive and best for scalping or early signal detection. RSI(14) provides balanced signals suitable for day trading. RSI(24) is smoother and better for swing trading and trend confirmation. You can disable any RSI period you don't need to reduce visual clutter.
Smoothing Methods: EMA provides balanced smoothing with moderate lag. RMA (Wilder's smoothing) is traditional and works well for RSI. Zero-Lag reduces lag but may increase noise. WMA gives more weight to recent values. Choose based on your preference for responsiveness vs. smoothness.
Forecasting: Linear regression is simplest and works well for trending markets. Polynomial regression captures curves and works better in ranging markets. Exponential smoothing adapts to trends. Moving average method is most conservative. Use confidence bands to assess forecast reliability.
Divergence: Strong divergence (with engulfing confirmation) is more reliable than regular divergence. Hidden divergence indicates continuation rather than reversal, useful for trend-following strategies. Pivot-based divergence provides more accurate detection by using actual pivot points instead of simple lowest/highest comparisons. Adjust lookback periods based on your timeframe: shorter for day trading, longer for swing trading. Pivot divergence period (default 5) controls the sensitivity of pivot detection.
Dynamic Thresholds: Dynamic OB/OS thresholds automatically adapt to volatility. In volatile markets, thresholds widen; in calm markets, they narrow. Adjust the volatility multiplier and base percentage to fine-tune sensitivity. Higher values create wider thresholds in volatile markets.
Alert Management: Enable alert cooldown (default 10 bars, recommended) to prevent alert spam. Each alert type has its own cooldown, so you can set different cooldowns for different signal types. For example, use shorter cooldown for synergy signals (high quality) and longer cooldown for crossovers (more frequent). The cooldown system works independently for each signal type, preventing spam while allowing different signal types to fire when appropriate.
Technical Specifications
- Pine Script Version: v6
- Indicator Type: Non-overlay (displays in separate panel below price chart)
- Repainting Behavior: Minimal - all signals are based on confirmed bars, ensuring accurate backtesting results
- Performance: Optimized with caching for ATR and volume calculations. Forecast arrays are dynamically managed to prevent memory accumulation.
- Compatibility: Works on all timeframes (1 minute to 1 month) and all instruments (stocks, forex, crypto, futures, etc.)
- Edge Case Handling: All calculations include safety checks for division by zero, NA values, and boundary conditions. Reset conditions and alert cooldowns handle edge cases where conditions never occurred or values are NA.
- Reset Logic: Separate reset conditions for buy signals (based on bottom conditions) and sell signals (based on top conditions) ensure logical correctness.
- Input Parameters: 60+ customizable parameters organized into logical groups for easy configuration. Configuration presets available for instant setup (Scalping, Day Trading, Swing Trading, Position Trading, Custom).
- Noise Reduction: Comprehensive noise reduction system with multiple filters (signal strength, extreme zone, consecutive bars, zone persistence, RSI slope) to reduce false signals.
- Pivot-Based Divergence: Enhanced divergence detection using actual pivot points for improved accuracy.
- Momentum Confirmation: RSI momentum filter ensures signals only fire when RSI is accelerating in the signal direction.
- Multi-Timeframe Confirmation: Optional higher timeframe RSI alignment for trend confirmation.
- Enhanced Pivot Trendlines: Trendline drawing with strength requirements, confirmation, and trend break detection.
Technical Notes
- All RSI values are clamped to 0-100 range to ensure valid oscillator values
- ATR and Volume SMA are cached for performance, updating on confirmed and real-time bars
- Reset conditions handle edge cases: if a condition never occurred, reset returns true (allows first signal)
- Alert cooldown handles na values: if no previous alert, cooldown allows the alert
- Forecast arrays are dynamically sized based on horizon, with unused lines cleaned up
- Fill logic uses a minimum gap (0.1) to ensure reliable polygon rendering in TradingView
- All calculations include safety checks for division by zero and boundary conditions. Regression functions validate that horizon doesn't exceed array size, and all array access operations include bounds checking to prevent out-of-bounds errors
- The script uses separate reset conditions for buy signals (based on bottom conditions) and sell signals (based on top conditions) for logical correctness
- Background coloring uses a fallback system: dynamic color takes priority, then RSI(6) heatmap, then monotone if both are disabled
- Noise reduction filters are applied after accuracy filters, providing multiple layers of signal quality control
- Pivot trendlines use strength requirements to filter weak pivots, reducing noise in trendline drawing. Historical trendlines are stored in arrays and automatically limited to prevent memory accumulation when "Keep Historical Trendlines" is enabled
- Volume climax and dry-up markers are positioned at the top of the pane for better visibility
- All calculations are optimized with conditional execution - features only calculate when enabled (performance optimization)
- Input Validation: Automatic cross-input validation ensures smoothing lengths are always less than RSI period lengths, preventing configuration errors
- Configuration Presets: Four optimized preset configurations (Scalping, Day Trading, Swing Trading, Position Trading) for instant setup, plus Custom mode for full manual control
- Constants Management: Magic numbers extracted to documented constants for improved maintainability and easier tuning (pivot tolerance, divergence thresholds, fill gap, etc.)
- TradingView Function Consistency: All TradingView functions (ta.crossover, ta.crossunder, ta.atr, ta.lowest, ta.highest, ta.lowestbars, ta.highestbars, etc.) and custom functions that depend on historical results (f_consecutiveBarConfirmation, f_rsiSlopeConfirmation, f_rsiZonePersistence, f_applyAllFilters, f_rsiMomentum, f_forecast, f_confirmPivotLow, f_confirmPivotHigh) are called on every bar for consistency, as recommended by TradingView. Results are then used conditionally when needed. This ensures consistent calculations and prevents calculation inconsistencies.

Order Flow AnalysisOrder Flow Pressure Suite — Wick, Volume & Absorption-Based Pressure Map
This indicator builds a composite buying/selling pressure score from candle structure, volume behavior, and absorption signals.
It is designed to infer the “intent” behind price moves by looking at how candles form, where they close, and how volume behaves — even without access to true bid/ask or footprint data.
Core Concepts
Wick-to-Body Analysis
The script evaluates the ratio of upper and lower wicks to the total candle range.
Strong wicks with relatively small bodies are treated as rejections :
Long upper wick → potential selling pressure / rejection of higher prices
Long lower wick → potential buying pressure / rejection of lower prices
Close Position Analysis
The close is normalized within the candle range:
Close near the high → bullish pressure
Close near the low → bearish pressure
Close near the middle → more neutral , context taken from wicks and volume
Volume Delta Estimation
Since true bid/ask data is not available on standard charts, the script estimates “volume delta” by distributing total volume between buyers and sellers based on candle characteristics:
Bull candles receive more “buying volume,” weighted toward closes near the high
Bear candles receive more “selling volume,” weighted toward closes near the low
This is an approximation of order flow, not a direct time & sales feed.
Absorption Detection
The script looks for candles where volume is high but price movement is relatively small .
This combination often suggests:
Bullish absorption → buyers absorbing aggressive selling (potential accumulation)
Bearish absorption → sellers absorbing aggressive buying (potential distribution)
Absorption zones are tracked over a configurable lookback and can be shaded in the background.
Composite Pressure Oscillator
All the above components (wicks, close position, heuristic volume delta, absorption bias) are blended into a single pressure score :
Values > 0 → net buying pressure
Values < 0 → net selling pressure
The raw score is smoothed with an EMA to reduce noise and create a cleaner oscillator line.
Divergence Detection
The indicator compares price pivots to pressure pivots:
Bullish divergence : price makes a lower low while pressure makes a higher low
Bearish divergence : price makes a higher high while pressure makes a lower high
These conditions can help highlight potential exhaustion or hidden participation from larger players.
Visual Elements
Histogram showing the intensity of buying/selling pressure
Color-coding for increasing vs. decreasing pressure
Background shading for detected absorption zones
Status table summarizing current pressure, trend bias, volume delta, wick signal, and absorption state in real time
How To Use
Use the pressure oscillator to gauge whether the current bar sequence is dominated by buyers or sellers. Strong positive readings may indicate sustained buying pressure; strong negatives may indicate sustained selling pressure.
Watch for divergences between price and the pressure oscillator around key levels, swings, or zones you already care about.
Use absorption zones and wick rejection signals as additional context around support/resistance, breakouts, or failed moves.
Treat all signals as context and confluence , not as stand-alone trade entries or exits. This tool is best used alongside your existing price action, volume, and risk management framework.
Important Notes & Limitations
This script does not access real bid/ask, footprint, or order book data . All volume delta and absorption interpretations are heuristic estimates derived from OHLCV candles.
Signals are probabilistic , not guarantees. They can be early, late, or outright wrong in fast or low-liquidity markets.
Always validate signals with your own analysis, timeframe alignment, and risk management. This indicator is intended as an analytical tool , not financial advice.

Inside Candle DivergenceStudy Material: Inside Candle Divergence Indicator (aiTrendview)
1. Introduction
The Inside Candle Divergence Indicator is a custom tool built on TradingView using Pine Script. It is designed to help traders identify potential reversal points or trend continuations using a mix of candlestick analysis, RSI (Relative Strength Index), VWAP (Volume Weighted Average Price), Pivot Points, and Volume analytics. The tool also provides a dashboard table on the chart, summarizing all key values in a single glance for traders and analysts.
This indicator is not just a signal generator but also an educational framework—explaining how different concepts in technical analysis combine to build a systematic approach for market entries and exits.
________________________________________
2. Core Concepts Behind the Tool
A. Inside Candle Pattern
An Inside Candle forms when the current candle’s high is lower than or equal to the previous candle’s high, and the low is higher than or equal to the previous candle’s low.
• This means the entire price action of the current candle is "inside" the range of the previous candle.
• A bullish inside candle occurs when the close is higher than the open.
• A bearish inside candle occurs when the close is lower than the open.
This pattern shows market indecision but also sets up potential breakouts or trend reversals.
________________________________________
B. RSI (Relative Strength Index)
The indicator calculates RSI using the formula from the ta.rsi() function in TradingView. RSI helps measure momentum in the market.
• A low RSI (below 25) signals an oversold zone → possible buy.
• A high RSI (above 75) signals an overbought zone → possible sell.
By combining RSI with the Inside Candle, the indicator ensures that signals are triggered only when momentum and price patterns confirm each other.
________________________________________
C. Buy & Sell Signals
• Buy Signal: Triggered when RSI < Buy Level (default 25) and a bullish inside candle forms.
• Sell Signal: Triggered when RSI > Sell Level (default 75) and a bearish inside candle forms.
When triggered, the chart displays a BUY (green label below candle) or SELL (red label above candle) marker. The indicator also saves the entry price and signal bar for future reference inside the dashboard.
________________________________________
D. VWAP (Volume Weighted Average Price)
VWAP is calculated using the typical price (H+L+C)/3 and weighting it by volume.
• VWAP shows the average trading price weighted by volume, widely used by institutions.
• The tool calculates the distance of price from VWAP in % terms.
• If price is far above VWAP, the market may be overheated (overbought). If far below, it may be undervalued (oversold).
________________________________________
E. Volume Analysis
The tool splits volume into Buy Volume and Sell Volume:
• Buy Volume: If close > open.
• Sell Volume: If close ≤ open.
• Cumulative totals are maintained, and percentages are calculated to show what proportion of total market volume is bullish vs bearish.
• A progress bar style visual (using blocks █) shows the dominance of buyers or sellers.
This allows traders to quickly measure whether buyers or sellers are controlling the market trend.
________________________________________
F. Daily Pivot Points
Pivot Points are calculated using the previous day’s high, low, and close:
• Pivot = (High + Low + Close) / 3
• R1, S1, R2, S2, R3, S3 levels are derived from this pivot.
• These levels act as support and resistance zones.
The script plots Pivot, R1, and S1 lines on the chart for easy reference.
________________________________________
G. Trend Direction
The indicator checks where the price is compared to R1 and S1:
• If price > R1 → Bullish Trend
• If price < S1 → Bearish Trend
• Otherwise → Neutral Trend
The trend direction is displayed in the dashboard with arrows (↑, ↓, →).
________________________________________
H. Price Change Calculation
The tool calculates:
• Price Change = Current Close – Previous Close
• Percentage Change = (Change / Previous Close) × 100
• Displays ▲ (green upward) or ▼ (red downward) with the exact percentage.
This gives traders a quick snapshot of intraday price movement.
________________________________________
I. Dashboard Table
One of the most powerful features is the real-time dashboard table shown on the chart. It contains:
1. Symbol & Price Info (Current ticker, price, change %)
2. RSI Reading (with color coding: green for oversold, red for overbought)
3. VWAP and Distance from VWAP
4. Volume Analysis with Progress Bar (Buy vs Sell %)
5. Pivot Levels (Pivot, R1, S1)
6. Trend Direction (Bullish, Bearish, Neutral)
7. Signal Status (Last Buy/Sell signal with entry price)
This reduces the need for multiple indicators and gives traders a command-center view directly on the chart.
________________________________________
J. Alerts
The tool generates alerts whenever a Buy or Sell condition is met. Traders can set up TradingView alerts to be notified instantly when:
• Buy Signal Alert → RSI oversold + Bullish inside candle
• Sell Signal Alert → RSI overbought + Bearish inside candle
This ensures no opportunity is missed even if you’re not actively monitoring the chart.
________________________________________
K. Background Highlights
The chart background also changes faintly (light green or light red) when a Buy or Sell condition is triggered. This gives traders visual confirmation along with signals and alerts.
________________________________________
3. Practical Use of This Tool
• Scalpers & Intraday Traders can use it for quick momentum-based entries.
• Swing Traders can use the RSI + Inside Candle + Pivot Points to find medium-term reversals.
• Analysts can use the dashboard for real-time summaries in reports.
• Volume Analysis helps understand institutional activity.
Remember: This is not a standalone holy grail. It must be used with proper risk management and confirmation from higher timeframes.
________________________________________
4. Strict Disclaimer (aiTrendview)
⚠️ Disclaimer from aiTrendview:
This indicator is designed for educational and analytical purposes only. It is not financial advice or a guaranteed trading strategy. Markets are inherently risky and unpredictable; past performance of indicators does not ensure future results. Trading involves risk of financial loss, and traders must use proper risk management, stop-loss, and independent judgment.
aiTrendview strictly follows TradingView.com rules and compliance guidelines.
Any misuse of this tool, its code, or analytical features for unauthorized commercial purposes, false promises, or misleading activities is strictly discouraged. The creators of this script and aiTrendview will not be responsible for any losses, damages, or misuse arising from its application. Always trade responsibly and only with money you can afford to lose.
________________________________________

Intraday Volume Pulse GSK-VIZAG-AP-INDIAIntraday Volume Pulse Indicator
Overview
This indicator is designed to track and visualize intraday volume dynamics during a user-defined trading session. It calculates and displays key volume metrics such as buy volume, sell volume, cumulative delta (difference between buy and sell volumes), and total volume. The data is presented in a customizable table overlay on the chart, making it easy to monitor volume pulses throughout the session. This can help traders identify buying or selling pressure in real-time, particularly useful for intraday strategies.
The indicator resets its calculations at the start of each new day and only accumulates volume data from the specified session start time onward. It uses simple logic to classify volume as buy or sell based on candle direction:
Buy Volume: Assigned to green (up) candles or half of neutral (doji) candles.
Sell Volume: Assigned to red (down) candles or half of neutral (doji) candles.
All calculations are approximate and based on available volume data from the chart. This script does not incorporate external data sources, order flow, or tick-level information—it's purely derived from standard OHLCV (Open, High, Low, Close, Volume) bars.
Key Features
Session Customization: Define the start time of your trading session (e.g., market open) and select from common timezones like Asia/Kolkata, America/New_York, etc.
Volume Metrics:
Buy Volume: Total volume attributed to bullish activity.
Sell Volume: Total volume attributed to bearish activity.
Cumulative Delta: Net difference (Buy - Sell), highlighting overall market bias.
Total Volume: Sum of all volume during the session.
Formatted Display: Volumes are formatted for readability (e.g., in thousands "K", lakhs "L", or crores "Cr" for large numbers).
Color-Coded Table: Uses a patriotic color scheme inspired by general themes (Saffron, White, Green) with dynamic backgrounds based on positive/negative values for quick visual interpretation.
Table Options: Toggle visibility and position (top-right, top-left, etc.) for a clean chart layout.
How to Use
Add to Chart: Apply this indicator to any symbol's chart (works best on intraday timeframes like 1-min, 5-min, or 15-min).
Configure Inputs:
Session Start Hour/Minute: Set to your market's open time (default: 9:15 for Indian markets).
Timezone: Choose the appropriate timezone to align with your trading hours.
Show Table: Enable/disable the metrics table.
Table Position: Place the table where it doesn't obstruct your view.
Interpret the Table:
Monitor for spikes in buy/sell volume or shifts in cumulative delta.
Positive delta (green) suggests buying pressure; negative (red) suggests selling.
Use alongside price action or other indicators for confirmation—e.g., high total volume with positive delta could indicate bullish momentum.
Limitations:
Volume classification is heuristic and not based on actual order flow (e.g., it splits doji volume evenly).
Data accumulation starts from the session time and resets daily; historical backtesting may be limited by the max_bars_back=500 setting.
This is for educational and visualization purposes only—do not use as sole basis for trading decisions.
Calculation Details
Session Filter: Uses timestamp() to define the session start and filters bars with time >= sessionStart.
New Day Detection: Resets volumes on daily changes via ta.change(time("D")).
Volume Assignment:
Buy: Full volume if close > open; half if close == open.
Sell: Full volume if close < open; half if close == open.
Cumulative Metrics: Accumulated only during the session.
Formatting: Custom function f_format() scales large numbers for brevity.
Disclaimer
This script is for educational and informational purposes only. It does not provide financial advice or signals to buy/sell any security. Always perform your own analysis and consult a qualified financial professional before making trading decisions.
© 2025 GSK-VIZAG-AP-INDIA

CoffeeShopCrypto Supply Demand PPO AdvancedCoffeeShopCrypto PPO Advanced is a structure-aware momentum oscillator and price-trend overlay designed to help traders interpret momentum strength, exhaustion, and continuation across evolving market conditions. It’s not a “buy/sell” signal tool — it's a momentum context tool that helps confirm trend intent.
Original Code derived from the Price Oscillator Indicators (PPO) found in the TradingView Technical Indicators categories. You can view the info and calculation for the original PPO here
www.tradingview.com
Much like the MACD, the PPO uses a couple lagging indicators to present Momentum as a percentage. But it lacks context to market structure.
What It’s Based On
This tool is based on a dual-moving-average PPO oscillator structure (Percentage Price Oscillator) enhanced by:
Oscillator pivot structure: detection of Lower Highs (LH) and Higher Lows (HL) inside the oscillator.
Detection of Supply and Demand Trends via Market Absorption
Ability to transfer its average plots to price action
Detection of Trend Exhaustion
Real-time price-based exhaustion levels: projecting potential future supply and demand using trendlines from weakening momentum.
Integrated fast and slow Moving Averages on price using the same inputs as the oscillator, to visualize alignment between short- and long-term trends.
These elements combine momentum context with price action in a visual, intuitive system.
How It Works
1. Oscillator Structure
LHs (above zero): momentum weakening in uptrends.
HLs (below zero): momentum strengthening in downtrends.
Only valid pivots are shown (e.g., an LH must be preceded by a valid LL).
2. Exhaustion Levels
Green demand lines: price is making new lows, but oscillator prints HL → potential exhaustion.
Red supply lines: price is making new highs, but oscillator prints LH → potential exhaustion.
These lines are future-facing, projecting likely reaction zones based on momentum weakening.
3. Moving Averages on Price
Two MAs are drawn on the price chart:
Fast MA (same length as PPO short input)
Slow MA (same length as PPO long input)
These are not signal lines — they're visual guides for trend alignment.
MA crossover = PO crosses zero. This indicates short- and long-term momentum are syncing — a powerful signal of trend conviction.
When price is above both MAs, and the PO is rising above zero, bullish momentum is dominant.
When price is below both MAs, and the PO is falling below zero, bearish momentum dominates.
How Traders Can Use It
✅ Spot Trend Initiation
Wait for clear trend confirmation in price.
Use PPO Momentum+ to confirm momentum structure is aligned (e.g., HH/HL in oscillator + price above both MAs).
🔁 Track Continuations
In uptrends, look for oscillator HH and HL sequences with price holding above both MAs.
In downtrends, seek LL and LH sequences with price below both MAs.
⚠️ Watch for Exhaustion
Price breaking below red (supply) lines after oscillator LH = bearish exhaustion signal.
Price breaking above green (demand) lines after oscillator HL = bullish exhaustion signal.
These levels act like pre-mapped S/R zones, showing where momentum previously failed and price may react.
Why This Is Different
Momentum tools often lag or mislead when used blindly. This tool visualizes structural failure in momentum and maps potential outcomes. The integration of oscillator and price-based tools ensures traders are always reading context, not just raw signals.
Demand Trendlines
Demand trendlines show us Wykoff's law of "Absorbed Supply Reversal" In real time.
When aggressive selling pressure is persistently absorbed by passive buying interest without significant downward price continuation, and supply becomes exhausted, the market structure shifts as demand regains control—resulting in a directional reversal to the upside.
This commonly happens in a 3 phase interaction of price.
1. Selling pressure is absorbed quickly by buyers.
This PPO tool will calculate the trend of this absorption process
2. After there is a notable Bearish Exhaustion of price action, the PPO tool will draw a trendline of this absorption showing us the potential future prices where aggressive buyers will want to step in at lower prices.
3. After higher lows are defined in the oscillator, you'll see prices react in a strong bullish pattern at this trendline where aggressive buyers stepped in to reverse price action to the upside.
Supply Trendlines
Supply trendlines show us Wykoff's law of "Absorbed Demand Reversal" In real time.
When aggressive buying pressure is persistently absorbed by passive selling interest without significant downward price continuation, and demand becomes exhausted, the market structure shifts as supply regains control—resulting in a directional reversal to the downside.
This commonly happens in a 3 phase interaction of price.
1. Buying pressure is absorbed quickly by sellers.
This PPO tool will calculate the trend of this absorption process.
2. After there is a notable Bullish Exhaustion of price action, the PPO tool will draw a trendline of this absorption showing us the potential future prices where aggressive sellers will want to step in at higher prices.
3. After lower highs are defined in the oscillator, you'll see prices react in a strong bearish pattern at this trendline where aggressive sellers stepped in to reverse price action to the downside.
Lower High and Higher Low Signals
When the oscillator signals Lower Highs or High Lows its only noting that momentum in that trend direction is slowing. THis indicates a coming pause in the market and the proceeding longs of an uptrend or shorts of a downtrend should be taken with caution.
**These LH and HL markers are not reading as divergences in price vs momentum.**
They are simply registering against the highs and lows of itself..
Moving Averages on Price Action
The Oscillator will cross over its ZERO level the same time your Short and Long MAs cross each other. This will indicate that the short term average trend is moving ahead of the long term.
Crossovers are not an entry signal. It's a method in determining you current timeframe trend strength. Always observe price action as it passes through each of your moving averages and compare it to the positioning and direction of the oscillator.
If price dips in between the moving averages while the oscillator still shows a strong trend strength, you can wait for price to move ahead of your fast moving average.
Bar Colors and Signal Line for Trend Strength
Good Bullish Trend = Oscillator above zero + Signal rising below Oscillator
Weak Bullish Trend = Oscillator above zero + Signal above Oscillator
Good Bearish Trend = Oscillator below zero + Signal falling above Oscillator
Weak Bearish Trend = Oscillator below zero + Signal below Oscillator
Bar Colors
Bars are colored to match Oscillator Momentum Strength. Colors are set by user.
Why alter the known PPO (Percentage Price Oscillator) in this manner?
The PPO tool is great for measuring the strength as percentage of price action over and average amount of candles however, with these changes,
you know have the ability to correlate:
Wycoff theory of supply and demand,
Measure the depth of reversals and pullback by price positioning against moving averages,
Project potential reversal and exhaustion pricing,
Visibly note the structure of momentum much like you would note market structure,
Its not enough to know there is momentum. Its better to know
A) Is it enough
B) Is there something in the way which will cause price to push back
C) Does this momentum correlate to the prevailing trend

Volume Aggression Monitor📌 Volume Aggression Monitor — Overview
This indicator helps identify buying and selling pressure (aggression) in real-time by analyzing how market participants are executing trades. It is composed of three main components:
🔍 What Does It Show?
🧭 1. The Thermometer (Above Candles)
🟢 Green Arrow (▲) → Buy Aggression: Buyers are lifting the ask.
🔴 Red Arrow (▼) → Sell Aggression: Sellers are hitting the bid.
⚪ Gray Square (■) → Neutral: No significant price movement or aggression.
💡 Neutral in this context means:
The price barely moved during the candle (open-close % change < direction_threshold, default 0.05%).
No clear buyer or seller dominance. It often appears during low volatility, equilibrium, or market indecision periods. This prevents noise and false directional readings due to random micro-movements.
📊 2. Percentage Panel
A table displaying recent trades or candle data (from a lower timeframe). Colored arrows indicate the direction of aggression (buy/sell). Shows volume, delta, and aggression %.
✅ Use it to:
Track clusters of buy/sell aggression. Spot momentum builds.
⏱️ 3. Cumulative Times & Sales Bar
A horizontal progress bar representing cumulative aggression.
Positive = Buy Aggression dominates.
Negative = Sell Aggression dominates.
📉 Even in sideways price movement, this bar shows who is winning the fight under the surface.
---
🧠 How to Use It:
🔹 Confirm Trades
Use the thermometer and aggression signals to confirm your strategy entries (e.g., breakouts, pullbacks, support/resistance).
🔹 Detect Dominance
Observe who is in control: buyers or sellers? Are they pressing or hesitating?
🔹 Filter Market Noise
The neutral state avoids misinterpreting small, meaningless movements as strong signals.
---
Component | Meaning
🌡️ Thermometer (▲ ▼ ■) | Who’s in control in each candle
📊 Percentage Panel | Trade details: direction, delta, aggression
📈 Cumulative T&S Bar | Overall aggression bias over time
---

Market Push Meter - CoffeeStyleMarket Push Meter - CoffeeKiller Indicator Guide
Welcome traders! This guide will walk you through the Market Push Meter indicator, a sophisticated volume analysis tool developed by CoffeeKiller with the help and assistance of FindBetterTrades that measures and visualizes the ongoing battle between buyers and sellers through volume pressure analysis.
🔔 **Warning: This Is Not a Standard Volume Indicator** 🔔 This indicator analyzes volume pressure in a unique way, combining directional volume with price action to identify market imbalances between buyers and sellers. All credit for the core logic for this indicator goes to FindBetterTrades and his/hers Volume Pressure Histogram (Normalized) (this is my adaptation and style added to that core logic, thus the CoffeeStyle name was added).
Core Concept: Volume Pressure Analysis
The foundation of this indicator lies in measuring the imbalance between buying and selling volume, providing insights into which market participants are exerting more pressure on price movements.
Volume Pressure Columns: Buying vs Selling Force
- Positive Green Columns: Net buying pressure
- Negative Red Columns: Net selling pressure
- Color intensity varies based on pressure strength
- Special coloring for new high/low boundaries
Marker Lines: Dynamic Support/Resistance
- High Marker Line (Magenta): Tracks the highest point reached during buying phases
- Low Marker Line (Cyan): Tracks the lowest point reached during selling phases
- Creates visual boundaries showing pressure extremes
Peak Detection System:
- Triangular markers identify significant local maxima and minima
- Background highlighting shows important pressure peaks
- Helps identify potential reversal points and pressure exhaustion
Reference Lines:
- Overbought Level: Threshold for extreme selling pressure
- Oversold Level: Threshold for extreme buying pressure
- Used to identify potential reversal zones
Core Components
1. Volume Pressure Calculation
- Separation of up-volume and down-volume
- Calculation of net volume pressure
- Smoothing for consistent visualization
- Normalization against total volume for percentage scaling
2. Boundary Tracking System
- Automatic detection of highest values in buying phases
- Automatic detection of lowest values in selling phases
- Step-line visualization of boundaries
- Color-coded for easy identification
3. Peak Detection System
- Identification of local maxima and minima
- Background highlighting of significant peaks
- Triangle markers for peak visualization
- Zero-line cross detection for trend changes
4. Threshold Settings
- Extreme threshold multiplier for identifying significant pressure
- Overbought/oversold levels for potential reversals
- Dynamic color coding based on pressure intensity
- Alert conditions for key pressure levels
Main Features
Volume Analysis Settings
- Customizable volume MA length
- Signal smoothing for clearer readings
- Optional log scale for handling wide range variations
- Adjustable threshold multiplier for sensitivity
Visual Elements
- Color-coded columns showing pressure direction and strength
- Dynamic marker lines for pressure boundaries
- Peak triangles for significant turning points
- Background highlighting for peak identification
- Overbought/oversold reference lines
Signal Generation
- Zero-line crosses for trend change signals
- Boundary breaks for pressure strength
- Peak formation for potential reversals
- Color changes for pressure direction and intensity
- Alert conditions for extreme pressure levels
Customization Options
- Volume analysis parameters
- Marker line visibility and colors
- Peak marker display options
- Log scale toggle for handling various markets
- Overbought/oversold threshold adjustments
Trading Applications
1. Trend Identification
- Volume pressure crossing above zero: buying pressure emerging
- Volume pressure crossing below zero: selling pressure emerging
- Column color: indicates pressure direction
- Column height: indicates pressure strength
- Signal line: confirms overall trend direction
2. Reversal Detection
- Peak triangles after extended trend: potential exhaustion
- Background highlighting: significant reversal points
- Volume pressure approaching marker lines: potential trend change
- Color shifts from bright to muted: decreasing pressure
- Readings beyond overbought/oversold levels: potential reversal zones
3. Pressure Analysis
- Breaking above previous high boundary: accelerating buying pressure
- Breaking below previous low boundary: accelerating selling pressure
- Special coloring (magenta/cyan): boundary breaks indicating strength
- Extreme readings: potential climactic buying/selling
4. Market Structure Assessment
- Consecutive higher peaks: strengthening buying structure
- Consecutive lower troughs: strengthening selling structure
- Peak comparisons: relative strength of pressure phases
- Boundary line steps: market structure levels
Optimization Guide
1. Volume Analysis Settings
- Volume MA Length: Default 25 provides balanced signals
- Lower values (10-15): More responsive, potentially noisier
- Higher values (30-50): Smoother, fewer false signals
- Signal Smoothing Length: Default 8 provides good balance
- Lower values: More responsive to pressure changes
- Higher values: Smoother trend identification
2. Threshold Settings
- Extreme Threshold Multiplier: Default 20.0
- Lower values: More signals, potentially more noise
- Higher values: Fewer signals, but more significant
- Overbought/Oversold Levels: Defaults at 20/-20
- Adjust based on instrument volatility
- Wider settings for more volatile instruments
3. Visual Customization
- Marker Line Colors: Adjust for visibility on your chart
- Peak Marker Color: Default yellow provides good contrast
- Enable/disable background highlights based on preference
- Consider log scale for instruments with wide volume ranges
4. Alert Settings
- Configure alerts for high buying pressure
- Configure alerts for high selling pressure
- Set additional alerts for zero-line crosses
- Consider timeframe when setting alert sensitivity
Best Practices
1. Signal Confirmation
- Wait for zero-line crosses to confirm pressure changes
- Look for peak formations to identify potential reversals
- Check for boundary breaks to confirm strong pressure
- Use with price action for entry/exit precision
- Consider extreme threshold crossings as significant signals
2. Timeframe Selection
- Lower timeframes: more signals, potential noise
- Higher timeframes: cleaner signals, less frequent
- Multiple timeframes: confirm signals across time horizons
- Match to your trading style and holding period
3. Market Context
- Strong buying phase: positive columns breaking above marker line
- Strong selling phase: negative columns breaking below marker line
- Columns approaching zero: potential pressure shift
- Columns beyond overbought/oversold: extreme conditions, potential reversal
4. Combining with Other Indicators
- Use with trend indicators for confirmation
- Pair with price action oscillators for divergence detection
- Combine with traditional volume indicators for validation
- Consider support/resistance levels with boundary lines
Advanced Trading Strategies
1. Boundary Break Strategy
- Enter long when volume pressure breaks above previous high marker line
- Enter short when volume pressure breaks below previous low marker line
- Use zero-line as initial stop-loss reference
- Take profits at formation of opposing peaks
2. Peak Trading Strategy
- Identify significant peaks with triangular markers
- Look for consecutive lower peaks in buying phases for shorting opportunities
- Look for consecutive higher troughs in selling phases for buying opportunities
- Use zero-line crosses as confirmation
3. Extreme Reading Strategy
- Look for volume pressure beyond overbought/oversold levels
- Watch for color changes and peak formations
- Enter counter-trend positions after confirmed peaks
- Use tight stops due to extreme market conditions
4. Volume Color Strategy
- Enter long when columns turn bright green (increasing buying pressure)
- Enter short when columns turn bright red (increasing selling pressure)
- Exit when color intensity fades (decreasing pressure)
- Use marker lines as dynamic support/resistance
Practical Analysis Examples
Bullish Market Scenario
- Volume pressure crosses above zero line
- Green columns grow in height and intensity
- High marker line forms steps upward
- Peak triangles appear at local maxima
- Background highlights appear at significant buying pressure peaks
Bearish Market Scenario
- Volume pressure crosses below zero line
- Red columns grow in depth and intensity
- Low marker line forms steps downward
- Peak triangles appear at local minima
- Background highlights appear at significant selling pressure troughs
Consolidation Scenario
- Volume pressure oscillates around zero line
- Column colors alternate frequently
- Marker lines remain relatively flat
- Few or no new peak highlights appear
- Pressure values remain small
Understanding Market Dynamics Through Market Push Meter
At its core, this indicator provides a unique lens to visualize market pressure through volume analysis:
1. Volume Imbalance: By separating and comparing buying volume (up candles) from selling volume (down candles), the indicator provides insights into which side is exerting more pressure in the market.
2. Normalized Pressure: The indicator normalizes volume pressure as a percentage of total volume, making it more comparable across different market conditions and instruments.
3. Dynamic Boundaries: The marker lines create a visual representation of the "high water marks" of pressure in both directions, helping to identify when markets are making new pressure extremes.
4. Exhaustion Signals: The peak detection system highlights moments where pressure has reached a local maximum or minimum, often precursors to reversals or consolidations.
Remember:
- Combine signals from volume pressure, marker lines, and peak formations
- Use appropriate timeframe settings for your trading style
- Customize the indicator to match your visual preferences and market
- Consider overall market conditions and correlate with price action
This indicator works best when:
- Used as part of a comprehensive trading system
- Combined with proper risk management
- Applied with an understanding of current market conditions
- Signals are confirmed by price action and other indicators
DISCLAIMER: This indicator and its signals are intended solely for educational and informational purposes. They do not constitute financial advice. Trading involves significant risk of loss. Always conduct your own analysis and consult with financial professionals before making trading decisions.

NUTJP CDC ActionZone 20241. Core Components of the Strategy
• Fast EMA and Slow EMA:
• The Fast EMA (shorter period) is more reactive to recent price changes.
• The Slow EMA (longer period) reacts slower and provides a smoother view of the overall trend.
• Relationship Between Fast EMA and Slow EMA:
• When the Fast EMA is above the Slow EMA, the market is considered Bullish.
• When the Fast EMA is below the Slow EMA, the market is considered Bearish.
2. Zones Based on Price and EMAs
The strategy defines six zones based on the position of the price, Fast EMA, and Slow EMA:
1. Green Zone (Buy):
• Bullish trend (Fast EMA > Slow EMA)
• Price is above the Fast EMA.
• Indicates a strong uptrend and suggests buying.
2. Blue and Light Blue Zones (Pre-Buy):
• Price is above the Fast EMA but below or near the Slow EMA.
• Represents potential bullish signals but not strong enough to trigger a buy.
3. Red Zone (Sell):
• Bearish trend (Fast EMA < Slow EMA)
• Price is below the Fast EMA.
• Indicates a strong downtrend and suggests selling or avoiding long trades.
4. Orange and Yellow Zones (Pre-Sell):
• Price is below the Fast EMA but above or near the Slow EMA.
• Represents potential bearish signals but not strong enough to trigger a sell.
These zones help traders visualize the market conditions and determine whether to buy, hold, or sell.
3. Buy and Sell Conditions
• Buy Condition:
A buy signal is triggered when:
• The price enters the Green Zone (Bullish trend and price > Fast EMA).
• It’s the first green candle after a non-green candle.
• Sell Condition:
A sell signal is triggered when:
• The price enters the Red Zone (Bearish trend and price < Fast EMA).
• It’s the first red candle after a non-red candle.
4. Trade Execution Logic
• Buy:
The strategy enters a long position (buy) when the above buy condition is met.
• Sell:
The strategy exits the long position when the sell condition is met.
Note: It doesn’t support short trades, meaning it doesn’t enter sell positions.
5. Momentum-Based Signals (Optional)
The indicator also includes momentum signals using Stochastic RSI to provide additional buy/sell signals:
• These are based on oversold and overbought levels of the Stochastic RSI.
• It filters signals depending on whether the trend is Bullish or Bearish.
6. Visual Features
The indicator is designed to make the trading zones and signals visually intuitive:
• Bar Colors:
Candlesticks are colored based on the current zone (e.g., Green for Buy, Red for Sell).
• EMA Lines:
The Fast EMA and Slow EMA are plotted, making it easy to see crossover points.
• Buy/Sell Signals:
Marked with shapes (e.g., circles) below/above bars for clarity.
7. Strategy Assumptions
• Trend-Following Nature:
This strategy assumes that trends persist. It works best in trending markets but might give false signals in ranging markets.
• Lagging Nature of EMAs:
As EMAs are lagging indicators, buy and sell signals may occur after significant moves have already begun or ended.
• Momentum Confirmation (Optional):
Adding momentum signals can help filter false signals, though it’s not part of the core logic.
8. Usage Recommendations
• Timeframes:
Works on various timeframes but may perform better on higher timeframes (e.g., 1H, Daily) to reduce noise.
• Markets:
Can be applied to stocks, forex, and cryptocurrencies.
• Backtesting and Optimization:
Before live trading, backtest the strategy with different EMA periods and other parameters to find optimal settings for your market and timeframe.

ICT Judas Swing | Flux Charts💎 GENERAL OVERVIEW
Introducing our new ICT Judas Swing Indicator! This indicator is built around the ICT's "Judas Swing" strategy. The strategy looks for a liquidity grab around NY 9:30 session and a Fair Value Gap for entry confirmation. For more information about the process, check the "HOW DOES IT WORK" section.
Features of the new ICT Judas Swing :
Implementation of ICT's Judas Swing Strategy
2 Different TP / SL Methods
Customizable Execution Settings
Customizable Backtesting Dashboard
Alerts for Buy, Sell, TP & SL Signals
📌 HOW DOES IT WORK ?
The strategy begins by identifying the New York session from 9:30 to 9:45 and marking recent liquidity zones. These liquidity zones are determined by locating high and low pivot points: buyside liquidity zones are identified using high pivots that haven't been invalidated, while sellside liquidity zones are found using low pivots. A break of either buyside or sellside liquidity must occur during the 9:30-9:45 session, which is interpreted as a liquidity grab by smart money. The strategy assumes that after this liquidity grab, the price will reverse and move in the opposite direction. For entry confirmation, a fair value gap (FVG) in the opposite direction of the liquidity grab is required. A buyside liquidity grab calls for a bearish FVG, while a sellside grab requires a bullish FVG. Based on the type of FVG—bullish for buys and bearish for sells—the indicator will then generate a Buy or Sell signal.
After the Buy or Sell signal, the indicator immediately draws the take-profit (TP) and stop-loss (SL) targets. The indicator has three different TP & SL modes, explained in the "Settings" section of this write-up.
You can set up alerts for entry and TP & SL signals, and also check the current performance of the indicator and adjust the settings accordingly to the current ticker using the backtesting dashboard.
🚩 UNIQUENESS
This indicator is an all-in-one suit for the ICT's Judas Swing concept. It's capable of plotting the strategy, giving signals, a backtesting dashboard and alerts feature. Different and customizable algorithm modes will help the trader fine-tune the indicator for the asset they are currently trading. Three different TP / SL modes are available to suit your needs. The backtesting dashboard allows you to see how your settings perform in the current ticker. You can also set up alerts to get informed when the strategy is executable for different tickers.
⚙️ SETTINGS
1. General Configuration
Swing Length -> The swing length for pivot detection. Higher settings will result in
FVG Detection Sensitivity -> You may select between Low, Normal, High or Extreme FVG detection sensitivity. This will essentially determine the size of the spotted FVGs, with lower sensitivies resulting in spotting bigger FVGs, and higher sensitivies resulting in spotting all sizes of FVGs.
2. TP / SL
TP / SL Method ->
a) Dynamic: The TP / SL zones will be auto-determined by the algorithm based on the Average True Range (ATR) of the current ticker.
b) Fixed : You can adjust the exact TP / SL ratios from the settings below.
Dynamic Risk -> The risk you're willing to take if "Dynamic" TP / SL Method is selected. Higher risk usually means a better winrate at the cost of losing more if the strategy fails. This setting is has a crucial effect on the performance of the indicator, as different tickers may have different volatility so the indicator may have increased performance when this setting is correctly adjusted.

Whale Trading SystemThis script is an advanced version of the distributional blocks script.
In distributional buys and sells:
I used a high - low cloud filter, which makes it more prudent to sell the next sell higher for sells and to buy the next purchase lower for buys.
I also used the Stochastic Money Flow Index function because it also uses volume to separate regions.
The long period is 52 weeks, which is equal to one year,
The short period is one-fourth of its value, which is equal to a financial quarter.
Then the values calculated with these periods are calculated by stochastic - rsi logic within the function, giving us two averages and separating the regions according to crossovers and crossunders .
In buys and sales, the higher your next distributional position size makes your profit more .
In the old system, there was a confusion as it was not divided into zones.
Because we divide into zones here, zone changes are the last stop to free up existing positions, and you must reopen each time you change zones.
And I changed standard distribution days, depending on the price change and the histogram, as StochMFI also took into account the volume.
In this way, there is sustainability.
I am also sharing my educational idea that explains the logic of this system in more detail :
Now that we have been divided into regions, a maximum of 10 pieces will suffice us.
And the regional shifts will allow us to sell and buy all of our position size, and now we will feel much more comfortable.
The most timeframe I find most accurate are the weekly bars.
Even in the example, we see how we have benefited from the sharp drop in bitcoin, while the price is falling, and we have lowered the average with higher-weight purchases than the previous one.
In both buys and sales here, both the histogram intensities and the average of the purchases you have reduced with the transactions, or the earnings you have increased with the sales, guide you.
In areas with high volatility ,if we adjust our positions properly, even if we follow the changes in the region, we will get rid of those situations with few wounds and we will surely catch the trend!
NOTE : Crossover/crossunder and distributional buy/sell alerts added.
Best regards , Noldo.

FCPO MASTER v6 – Sideway + Breakout + OB + FVG (TUPLE SAFE)TL;DR cepat
1. Gunakan M5 untuk entry & OB/FVG confirmation.
2. Gunakan M15 untuk confirm trend/false breakout.
3. Gunakan H1 untuk bias arah (overall market).
4. Entry hanya bila signal + OB/FVG/candle rejection (script buatkan).
5. SL 5–8 tick, TP 10–25 tick ikut setup (sideway vs breakout).
6. Follow checklist setiap trade — jangan lompat.
________________________________________
Setup awal (1–2 min)
1. Pasang script FCPO Sideway MASTER – OB + Imbalance + Confirmation di TradingView.
2. Timeframes: buka M5, M15, H1 (susun 3 chart atau 1 chart multi-timeframe).
3. Input default: ATR14, Breakout Buffer 5 tick, RangeLen 20, ADX14, TP12, SL8. (Kau boleh tweak nanti).
4. Aktifkan alerts pada BUY Confirm / SELL Confirm / Sideway Buy / Sideway Sell.
________________________________________
Step-by-step trading process
1) Mulakan dengan H1 — tentukan bias HTF
• Lihat H1 untuk jawapan: Trend Up / Down / Sideway.
• Rule ringkas:
o ADX H1 > 20 + price above H1 EMA → bias Bull
o ADX H1 > 20 + price below H1 EMA → bias Bear
o ADX H1 < 20 → market HTF sideway (no strong bias)
Kenapa: H1 bagi kau idea “kalau breakout pada M5, patut follow atau tolak”.
________________________________________
2) Pergi ke M15 — confirm trend & valid breakout
• M15 kena setuju dengan idea breakout.
o Untuk strong breakout: M15 kena tunjuk candle close di atas/bawah range + volume naik.
o Kalau M5 breakout tapi M15 tak setuju (M15 masih sideway) → treat as fakeout. Jangan masuk.
________________________________________
3) M5 — cari entry & confirmation (OB/FVG + candle)
• M5 adalah tempat kau buat keputusan masuk.
• Tunggu script keluarkan Sideway Buy/Sell atau Breakout Buy/Sell.
• CONFIRM entry mesti ada sekurang-kurangnya 1 dari:
o Bull/Bear Order Block searah signal (script detect).
o FVG / Imbalance zone dipenuhi & price retest.
o Candle rejection (pinbar / bearish/bullish engulfing) pada zone.
Jika tiada confirmation → no trade.
________________________________________
4) Checklist sebelum tekan Buy/Sell (MUST)
• H1 bias tidak melawan trade (prefer sama arah).
• M15 confirm breakout / trend or neutral.
• Script keluarkan signal (sideway or breakout).
• OB or FVG atau candle rejection ada.
• ATR kenaikan jika breakout (untuk breakout trade).
• Volume spike jika breakout.
• Risk:SL <= 2% akaun (position sizing).
Kalau semua ticked → boleh entry.
________________________________________
5) Setting SL / TP & position sizing
• Sideway (scalp): SL = 5–8 tick, TP = 8–12 tick.
• Breakout (trend): SL = 8–12 tick, TP = 15–25+ tick (trail later).
• Position sizing: Risk per trade 1–2%.
o Lot size = (Account Risk RM × 1 tick value) / (SL ticks × tickValue) — (kalau kau gunakan fixed tick value, adjust ikut lot).
(Script tunjuk SL & TP label — follow itu.)
________________________________________
6) Entry types
• A. Sideway Reversal (M5)
o Signal: Sideway Buy / Sideway Sell
o Confirm: OB/FVG or rejection candle at range bottom/top
o Trade: scalp target 8–12 tick, tight SL 5–8 tick
• B. Breakout (M5 entry, M15 confirm)
o Signal: Breakout Buy/Sell (Strong)
o Confirm: ATR expanding + volume spike + M15 alignment
o Trade: trend follow, TP 15–25 tick, trailing stop active
• C. Retest Entry
o Breakout happens, price returns to retest range / OB / FVG → wait for rejection candle then enter. Safer.
________________________________________
7) Trailing & exit rules
• Jika useTrail = true script plots trailing stop (ATR × multiplier).
• Exit rules:
1. Hit TP → close.
2. Hit SL → close.
3. If trailing stop hit → close.
4. If opposing confirmed signal muncul (e.g., SELL confirm while long) → consider close early.
5. If H1 bias flips strongly vs trade → tighten stop or close.
________________________________________
8) Multiple signals & scaling
• Never add to losing position (no averaging down).
• If want scale-in on confirmed trend: add 1 partial size after price moves +10–12 tick in favor and shows continuation candle + no bearish OB/FVG.
• Keep aggregated risk within your max (2–3%).
________________________________________
9) Example trade walkthrough (concrete)
• RangeHigh = 4065, RangeLow = 4035 (contoh).
• Market sideway M5.
Case A — Sideway Sell:
1. Price touches 4064–4065, script shows sidewaySell.
2. Lihat OB: ada bear OB zone di 4062–4066 → confirm.
3. Candle rejection (bearish pinbar) muncul → enter SELL M5.
4. Set SL = 5 tick above rangeHigh = 4070, TP = 10 tick → 4055.
5. Trail jika price turun > 8 tick: aktifkan trailing.
6. Close at TP or trail/SL.
Case B — Breakout Buy:
1. Price closes above 4065 + 5 tick buffer = 4070 on M5. Script shows trueBreakUp.
2. M15 shows candle close above M15 resistance + volume spike → confirm.
3. Enter BUY, SL = 8 tick below entry, TP initial 20 tick, trail with ATR×1.5.
4. Move stop to breakeven after +10 tick, scale out half at +12 tick, leave rest to trail.
________________________________________
10) Journal & review
• Semua trade: record entry time, TF, reason (which confirmations), SL/TP, result, lesson.
• Weekly review: check which confirmation worked best (OB vs FVG vs candle) and tweak settings.
________________________________________
11) Tweaks / optimisations cepat
• Jika terlalu banyak false sideway signals → kurangkan touchDist ke 2 tick.
• Kalau fakeout breakout banyak → tambah tickBuf ke 6–8.
• Nak lebih konservatif → cuma trade breakout yang juga setuju M15.
________________________________________
12) Alerts & execution (practical)
• Pasang alert pada BUY Confirm / SELL Confirm (script).
• Kalau kau guna broker yang support one-click order, siap sediakan template order (SL/TP default).
• Kalau manual, bila alert masuk: buka M5, cepat confirm OB/FVG & candle rejection → entry.
________________________________________
Quick reference table (handy)
• TF utama entry: M5
• Confirm mid-TF: M15
• Bias HTF: H1
• Sideway SL/TP: SL 5–8, TP 8–12
• Breakout SL/TP: SL 8–12, TP 15–25+
• Mandatory confirmation: (Script signal) + (OB or FVG or candle)

PRO Trade Manager//@version=5
indicator("PRO Trade Manager", shorttitle="PRO Trade Manager", overlay=false)
// ============================================================================
// INPUTS
//This code and all related materials are the exclusive property of Trade Confident LLC. Any reproduction, distribution, modification, or unauthorized use of this code, in whole or in part, is strictly prohibited without the express written consent of Trade Confident LLC. Violations may result in civil and/or criminal penalties to the fullest extent of the law.
// © Trade Confident LLC. All rights reserved.
// ============================================================================
// Moving Average Settings
maLength = input.int(15, "Signal Strength", minval=1, tooltip="Length of the moving average to measure deviation from (lower = more sensitive)")
maType = "SMA" // Fixed to SMA, no longer user-selectable
// Deviation Settings
deviationLength = input.int(20, "Deviation Period", minval=1, tooltip="Lookback period for standard deviation calculation")
// Signal Frequency dropdown - controls both upper and lower thresholds
signalFrequency = input.string("More/Good Accuracy", "Signal Frequency", options= ,
tooltip="Normal/Highest Accuracy = ±2.0 StdDev | More/Good Accuracy = ±1.5 StdDev | Most/Moderate Accuracy = ±1.0 StdDev")
// Set thresholds based on selected frequency
upperThreshold = signalFrequency == "Most/Moderate Accuracy" ? 1.0 : signalFrequency == "More/Good Accuracy" ? 1.5 : 2.0
lowerThreshold = signalFrequency == "Most/Moderate Accuracy" ? -1.0 : signalFrequency == "More/Good Accuracy" ? -1.5 : -2.0
// Continuation Signal Settings
atrMultiplier = input.float(2.0, "TP/DCA Market Breakout Detection", minval=0, step=0.5, tooltip="Number of ATR moves required to trigger continuation signals (Set to 0 to disable)")
// Visual Settings
showMA = false // MA display removed from settings
showSignals = input.bool(true, "Show Alert Signals", tooltip="Show visual signals when price is overextended")
// ============================================================================
// CALCULATIONS
// ============================================================================
// Calculate Moving Average based on type
ma = switch maType
"SMA" => ta.sma(close, maLength)
"EMA" => ta.ema(close, maLength)
"WMA" => ta.wma(close, maLength)
"VWMA" => ta.vwma(close, maLength)
=> ta.sma(close, maLength)
// Calculate deviation from MA
deviation = close - ma
// Calculate standard deviation
stdDev = ta.stdev(close, deviationLength)
// Calculate number of standard deviations away from MA
deviationScore = stdDev != 0 ? deviation / stdDev : 0
// Smooth the deviation score slightly for cleaner signals
smoothedDeviation = ta.ema(deviationScore, 3)
// ============================================================================
// SIGNALS
// ============================================================================
// Overextended conditions
overextendedHigh = smoothedDeviation >= upperThreshold
overextendedLow = smoothedDeviation <= lowerThreshold
// Signal triggers (crossing into overextended territory)
bullishSignal = ta.crossunder(smoothedDeviation, lowerThreshold)
bearishSignal = ta.crossover(smoothedDeviation, upperThreshold)
// Track if we're in bright histogram zones
isBrightGreen = smoothedDeviation <= lowerThreshold
isBrightRed = smoothedDeviation >= upperThreshold
// Track if we were in bright zone on previous bar
wasBrightGreen = smoothedDeviation <= lowerThreshold
wasBrightRed = smoothedDeviation >= upperThreshold
// Detect oscillator turning up after bright green (buy signal)
// Trigger if we were in bright green and oscillator turns up, even if no longer bright green
oscillatorTurningUp = smoothedDeviation > smoothedDeviation
buySignal = barstate.isconfirmed and wasBrightGreen and oscillatorTurningUp and smoothedDeviation <= smoothedDeviation
// Detect oscillator turning down after bright red (sell signal)
// Trigger if we were in bright red and oscillator turns down, even if no longer bright red
oscillatorTurningDown = smoothedDeviation < smoothedDeviation
sellSignal = barstate.isconfirmed and wasBrightRed and oscillatorTurningDown and smoothedDeviation >= smoothedDeviation
// ============================================================================
// ATR-BASED CONTINUATION SIGNALS
// ============================================================================
// Calculate ATR for distance measurement
atrLength = 14
atr = ta.atr(atrLength)
// Track price levels when ANY sell or buy signal occurs (original or continuation)
var float lastSellPrice = na
var float lastBuyPrice = na
// Initialize tracking on original signals
if sellSignal
lastSellPrice := close
if buySignal
lastBuyPrice := close
// Continuation Sell Signal: Price moved up by ATR multiplier from last red dot
// Disabled when atrMultiplier is set to 0
continuationSell = atrMultiplier > 0 and barstate.isconfirmed and not na(lastSellPrice) and close >= lastSellPrice + (atrMultiplier * atr)
// Continuation Buy Signal: Price moved down by ATR multiplier from last green dot
// Disabled when atrMultiplier is set to 0
continuationBuy = atrMultiplier > 0 and barstate.isconfirmed and not na(lastBuyPrice) and close <= lastBuyPrice - (atrMultiplier * atr)
// Update reference prices when continuation signals trigger (reset the 3 ATR counter)
if continuationSell
lastSellPrice := close
if continuationBuy
lastBuyPrice := close
// Combine original and continuation signals for plotting
allBuySignals = buySignal or continuationBuy
allSellSignals = sellSignal or continuationSell
// Track if a signal occurred to keep it visible on dashboard
// Signals trigger at barstate.isconfirmed (bar close)
var bool showBuyOnDashboard = false
var bool showSellOnDashboard = false
// Update dashboard flags immediately when signals occur
if allBuySignals
showBuyOnDashboard := true
showSellOnDashboard := false
else if allSellSignals
showSellOnDashboard := true
showBuyOnDashboard := false
else if barstate.isconfirmed
// Reset flags on bar close if no new signal
showBuyOnDashboard := false
showSellOnDashboard := false
// ============================================================================
// PLOTTING
// ============================================================================
// Professional color scheme
var color colorBullish = #00C853 // Professional green
var color colorBearish = #FF1744 // Professional red
var color colorNeutral = #2962FF // Professional blue
var color colorGrid = #363A45 // Dark gray for lines
var color colorBackground = #1E222D // Chart background
// Dynamic line color based on value
lineColor = smoothedDeviation > upperThreshold ? colorBearish :
smoothedDeviation < lowerThreshold ? colorBullish :
smoothedDeviation > 0 ? color.new(colorBearish, 50) :
color.new(colorBullish, 50)
// Plot the deviation oscillator with dynamic coloring
plot(smoothedDeviation, "Deviation Score", color=lineColor, linewidth=2)
// Plot zero line
hline(0, "Zero Line", color=color.new(colorGrid, 0), linestyle=hline.style_solid, linewidth=1)
// Subtle fill for overextended zones (without visible threshold lines)
upperLine = hline(upperThreshold, "Upper Threshold", color=color.new(color.gray, 100), linestyle=hline.style_dashed, linewidth=1)
lowerLine = hline(lowerThreshold, "Lower Threshold", color=color.new(color.gray, 100), linestyle=hline.style_dashed, linewidth=1)
fill(upperLine, hline(3), color=color.new(colorBearish, 95), title="Overextended High Zone")
fill(lowerLine, hline(-3), color=color.new(colorBullish, 95), title="Overextended Low Zone")
// Histogram style visualization (optional alternative)
histogramColor = smoothedDeviation >= upperThreshold ? color.new(colorBearish, 20) :
smoothedDeviation <= lowerThreshold ? color.new(colorBullish, 20) :
smoothedDeviation > 0 ? color.new(colorBearish, 80) :
color.new(colorBullish, 80)
plot(smoothedDeviation, "Histogram", color=histogramColor, style=plot.style_histogram, linewidth=3)
// ============================================================================
// BUY/SELL SIGNAL MARKERS
// ============================================================================
// Plot buy signals at -3.5 level (includes both initial and extended signals)
plot(allBuySignals ? -3.5 : na, title="Buy Signal", style=plot.style_circles,
color=color.new(colorBullish, 0), linewidth=4)
// Plot sell signals at 3.5 level (includes both initial and extended signals)
plot(allSellSignals ? 3.5 : na, title="Sell Signal", style=plot.style_circles,
color=color.new(colorBearish, 0), linewidth=4)
// ============================================================================
// ALERTS - SIMPLIFIED TO ONLY TWO ALERTS
// ============================================================================
// Alert 1: Long Entry/Short TP - fires on ANY green dot (original or continuation)
alertcondition(allBuySignals, "Long Entry/Short TP", "Long Entry/Short TP")
// Alert 2: Long TP/Short Entry - fires on ANY red dot (original or continuation)
alertcondition(allSellSignals, "Long TP/Short Entry", "Long TP/Short Entry")
// ============================================================================
// DATA DISPLAY
// ============================================================================
// Create a professional table for current readings
var color tableBgColor = #1a2332 // Dark blue background
var table infoTable = table.new(position.middle_right, 2, 2, border_width=1,
border_color=color.new(#2962FF, 30),
frame_width=1,
frame_color=color.new(#2962FF, 30))
if barstate.islast
// Determine status
statusText = overextendedHigh ? "OVEREXTENDED ↓" :
overextendedLow ? "OVEREXTENDED ↑" :
smoothedDeviation > 0 ? "Buyers In Control" : "Sellers In Control"
statusColor = overextendedHigh ? color.new(colorBearish, 0) :
overextendedLow ? color.new(colorBullish, 0) :
color.white
// Background color for status cell
statusBgColor = color.new(tableBgColor, 0)
// Status Row
table.cell(infoTable, 0, 0, "Status",
bgcolor=color.new(tableBgColor, 0),
text_color=color.white,
text_size=size.normal)
table.cell(infoTable, 1, 0, statusText,
bgcolor=statusBgColor,
text_color=statusColor,
text_size=size.normal)
// Signal Row - always show
table.cell(infoTable, 0, 1, "Signal",
bgcolor=color.new(tableBgColor, 0),
text_color=color.white,
text_size=size.normal)
// Show signal if flags are set (will stay visible during the bar)
if showBuyOnDashboard or showSellOnDashboard
// Green dot (buy signal) = "Long Entry/Short TP" with arrow up, white text on green background
// Red dot (sell signal) = "Long TP/Short Entry" with arrow down, white text on red background
signalText = showBuyOnDashboard ? "↑ Long Entry/Short TP" : "↓ Long TP/Short Entry"
signalColor = showBuyOnDashboard ? color.new(colorBullish, 0) : color.new(colorBearish, 0)
table.cell(infoTable, 1, 1, signalText,
bgcolor=signalColor,
text_color=color.white,
text_size=size.normal)
else
table.cell(infoTable, 1, 1, "Watching...",
bgcolor=color.new(tableBgColor, 0),
text_color=color.new(color.white, 60),
text_size=size.normal)

Volume Gaps & Imbalances (Zeiierman)█ Overview
Volume Gaps & Imbalances (Zeiierman) is an advanced market-structure and order-flow visualizer that maps where the market traded, where it did not, and how buyer-vs-seller pressure accumulated across the entire price range.
The core of the indicator is a price-by-price volume profile built from Bullish and Bearish volume assignments. The script highlights:
True zero-volume voids (regions of no traded volume)
Bull/Bear imbalance rows (horizontal volume slices)
A multi-section Delta Panel, showing aggregated Buy–Sell pressure per vertical sector
A clean separation between profile structure, volume efficiency, and delta flows
Together, these components reveal market inefficiencies, displacement zones, and fair-value regions that price tends to revisit — making it an exceptional tool for structural trading, order-flow analysis, and contextual confluence.
Highlights
Identifies true volume voids (untraded price regions), more precisely than standard FVG tools
Plots Bull vs Bear volume at each price row for fine-grained imbalance reading
Includes a sector-based Delta Grid that aggregates Buy–Sell dominance
█ How It Works
⚪ Profile Construction
The indicator scans a user-defined Lookback window and divides the full high–low range into Rows. Each bar's volume is allocated into the correct price bucket:
Bullish volume when close > open
Bearish volume when close <= open
This produces three values per price level:
Bull Volume
Bear Volume
Total Volume & Imbalance Profile
Rows where no volume at all occurred are marked as volume gaps — signaling true untraded zones, often produced by impulsive imbalanced moves.
⚪ Zero-Volume Gaps (True Voids)
Unlike candle-based Fair Value Gaps (FVGs), volume gaps identify the deeper, structural inefficiency: Price moved so fast through a region that no trades occurred at those prices. These areas often attract revisits because liquidity never exchanged hands there.
⚪ Bull/Bear Volume Imbalance
Every price row is drawn using two colored horizontal segments:
Bull segment proportional to bullish volume
Bear segment proportional to bearish volume
This reveals where buyers or sellers dominated individual price levels.
⚪ Delta Panel
The full volume profile is cut into Summary Sections. For each block, the script computes: Δ = (Bull Volume − Bear Volume) ÷ Total Volume × 100%
█ How to Use
⚪ Spot True Voids & Inefficiencies
Zero-volume zones highlight where the price moved without trading. These areas often behave like:
Refill zones during retracements
Targets during displacement
Thin regions price slices through quickly
Ideal for both SMC-style trading and structural mapping.
⚪ Identify Bull/Bear Control at Each Price Level
Broad bullish segments show zones of buyer absorption, while wide bearish slices reveal seller control.
This helps you interpret:
Where buyers supported the price
Where sellers defended a level
Which price levels matter for continuation or reversal
⚪ Use Delta Sectors for Contextual Direction
The delta panel shows where market pressure is accumulating, revealing whether the profile is dominated by:
Bullish flow (positive delta)
Bearish flow (negative delta)
Neutral flow (balanced or minimal delta)
█ Settings
Lookback – Number of bars scanned to build the profile.
Rows – Vertical resolution of price bins.
Source – Price source used to assign volume into rows.
Summary Sections – Number of vertical delta sectors.
Summary Width – Horizontal size of the delta bar panel.
Gap From Profile – Distance between profile and delta grid.
Show Delta Text – Toggle Δ% labels.
-----------------
Disclaimer
The content provided in my scripts, indicators, ideas, algorithms, and systems is for educational and informational purposes only. It does not constitute financial advice, investment recommendations, or a solicitation to buy or sell any financial instruments. I will not accept liability for any loss or damage, including without limitation any loss of profit, which may arise directly or indirectly from the use of or reliance on such information.
All investments involve risk, and the past performance of a security, industry, sector, market, financial product, trading strategy, backtest, or individual's trading does not guarantee future results or returns. Investors are fully responsible for any investment decisions they make. Such decisions should be based solely on an evaluation of their financial circumstances, investment objectives, risk tolerance, and liquidity needs.

Volume Pressure and PercentVPP Volume Pressure and Percentage Indicator with a Volume Trendline that indicates which side is driving the flow.
Features:
1. Buy/Sell Pressure Bars (Core Volume Split)
The indicator separates each candle’s volume into buy volume (green) above the zero line and sell volume (red) below it. This gives you a real-time visualization of which side is more aggressive within the current bar. Instead of waiting for prices to move or candles to close, you can instantly see whether buyers or sellers are stepping in.
2. Dynamic Total Volume (Invisible Histogram + Status Line Color)
The total volume of each bar is tracked behind the scenes and displayed in the pinned status line using a dynamic color—green when buyers dominate, red when sellers dominate. The histogram for total volume is invisible to keep the chart clean, but the total volume figure stays visible and changes color based on who is in control. This gives you instant confirmation of whether institutional-sized volume supports the direction shown by the buy/sell pressure, which is especially valuable when evaluating the risk or conviction behind a potential entry.
3. Percentage Mode (% of Bar Volume)
When toggled on, the indicator converts each bar into percent buy vs percent sell, normalizing all flow to a 0–100% scale. This mode is incredibly useful when comparing pressure across different times of day, gaps, or varying volume conditions—such as early morning spikes versus lunchtime chop. By removing absolute volume from the equation, you gain a clean look at the actual imbalance between buyers and sellers.
4. 70% Pressure Band (Imbalance Threshold Zone)
In percentage mode, the indicator displays a subtle 70% band (a light gray zone) above and below the zero line, showing where buy or sell pressure reaches extreme dominance (≥70%). When a bar’s buy or sell percentage enters this zone, it highlights moments of exhaustion, acceleration, or potential reversal. The band acts like a real-time overbought/oversold gauge specifically for volume imbalance, not price.
5. Trend Line (Net Pressure Trend / Reversal Detector)
The trend line smooths out the net volume pressure (buy volume minus sell volume or its percentage equivalent) and shows the overall direction of order flow. When the line slopes upward, buyers are gaining control; when it slopes downward, sellers are taking over. This trend line acts as a real-time momentum indicator based directly on flow rather than price. Because it reacts quickly to intrabar shifts in buy/sell pressure, it often turns before price does—giving you a measurable timing edge.
6. Auto-Selecting Trend Source (Volume Net, Percent Net, or CVD)
The indicator lets you choose how the trend line is calculated: Volume Net (buy minus sell volume), Percent Net (normalized imbalance), or CVD (Cumulative Volume Delta) for long-term flow bias. The default “Auto” mode automatically switches between Volume Net and Percent Net depending on which view you’re using. This flexibility allows the trend line to remain meaningful whether you’re analyzing raw volume or normalized percentage data.
7. Pinned (Status Line) Totals in K/M/B Format
Regardless of whether you’re in volume or percentage mode, the indicator always displays Total Volume, Buy Volume, and Sell Volume in the status line using abbreviated K, M, B formatting. These values update in real time and are color-coded: green for bullish dominance, red for bearish. This gives you a concise snapshot of order flow strength on every bar.
---------------------
How To Use:
Support Level Zones
• Watch for Buy bars increasing + Trend line flipping up right at or slightly below support.
• This often signals absorption — market makers filling large buy orders before reversal.
• Confirmation: Price reclaims VWAP ... enter calls / longs.
Resistance Level Zones
• Watch for Sell bars increasing + Trend line flattening/turning down near resistance.
• This signals distribution or stop runs.
• Confirmation: Price rejects VWAP ... enter puts / shorts.
Breakout Traps
• Sometimes you’ll see price break a level, but the flow doesn’t confirm (buy volume doesn’t expand).
• That’s a false breakout — fade it with options opposite the move.

Lynie's V9 SELL🟢🔴 Lynie’s V8 — BUY & SELL (Mirrored, Interlocking System)
Lynie’s V8 is a paired long/short engine built as two mirrored scripts—Lynie’s V8 BUY and Lynie’s V8 SELL—that read price the same way, flip conditions symmetrically, and manage trades with the exact logic on opposite sides. Use either one standalone or run both together for full two-sided automation of entries, re-entries, caution states, and adaptive SL/TP.
✳️ What “mirrored” means here
Supertrend Tri-Stack (10/11/12):
BUY: ST10 primary pierce; ST12 fallback; “PAG Buy” when price pierces any ST while above the other two.
SELL: Exact inverse—ST10 primary pierce down; ST12 fallback; “PAG Sell” when price pierces any ST while below the other two.
Re-Enter Clusters:
BUY: Ratcheted up (Heikin-Ashi green holds/tightens).
SELL: Ratcheted down (Heikin-Ashi red holds/tightens).
Both sides use the same cluster age/decay math, care penalties, session awareness, and fast-candle tightening.
Care Flags (context risk):
Ichimoku, MACD, RSI combine into single and paired flags that tighten or widen offsets on both sides with the same scoring.
VWAP–EMA50 (5m) cluster gate:
Identical distance checks for BUY/SELL. When the mean cluster is present, offsets and labels adapt (tighter/“riskier scalp” messaging).
Golden Pocket A/B/C (prev-day):
Same fib boxes & labeling (gold tone) on both sides to call out TP-friendly zones.
SL/TP Envelope:
Shared dynamic engine: per-bar decay, fast-candle expansion, and care-based compress/relax—all mirrored for up/down.
Caution Labels:
BUY side prints CAUTION SELL if HA flips red inside an active long cluster.
SELL side prints CAUTION BUY if HA flips green inside an active short cluster.
Same latching & auto-release behavior.
🧠 Core workflow (both sides)
Primary trigger via ST10 pierce (structure shift) with an ST12 fallback when ST10 didn’t qualify.
PAG Mode when price is already on the right side of the other two STs—strongest conviction.
Cluster phase begins after a signal: ratcheted re-entry level, session-aware offsets, dynamic tightening on fast bars.
Care system shapes every re-entry & SL/TP label (Ichi/MACD/RSI combos + VWAP/EMA gate + QQE).
Protective layer: SL-wick and SL-body logic, caution flips, and “hold 1 bar” cluster carry after SL to avoid whipsaw spam.
🔎 Labels & messages (shared vocabulary)
Lynie’s / Lynie’s+ / Lynie’s++ — strength tiers (ST12 involvement & clean context).
Re-Enter / Excellent Re-Enter — cluster pullback quality; ratchet shows the “must-hold” zone.
SL&TP (n) — live offset multiplier the engine is using right now.
CAUTION BUY / CAUTION SELL — HA flip against the active side inside the cluster.
Restart Next Candle — visual cue to re-arm after a confirmed signal bar.
⚡ Why run both together
Continuity: When a long cycle ends (SL or caution degradation), the SELL engine is already tracking the inverse without re-tuning.
Symmetry: Same math, same signals, opposite direction—no hidden biases.
Coverage: Trend hand-offs are cleaner; you don’t miss early shorts after a long fade (and vice versa).
🔧 Recommended usage
Intraday futures (ES/NQ) or any liquid market.
Keep the VWAP–EMA cluster ON; it filters FOMO chases.
Honor Caution flips inside cluster—scale down or wait for the next clean re-enter.
Treat Golden Zones as TP magnets, not guaranteed reversals.
📌 Notes
Both scripts are Pine v6 and independent. Load BUY and SELL together for the full experience.
All offsets (re-enter & SL/TP) are visible in labels—so you always know why a zone is where it is.
Alerts are provided for signals, re-enter hits, caution, and SL events on both sides.
Summary: Lynie’s V8 BUY & SELL are vice-versa twins—one framework, two directions—delivering consistent entries, adaptive re-entries, and contextual risk management whether the market is pressing up or breaking down.